Fig. 7.
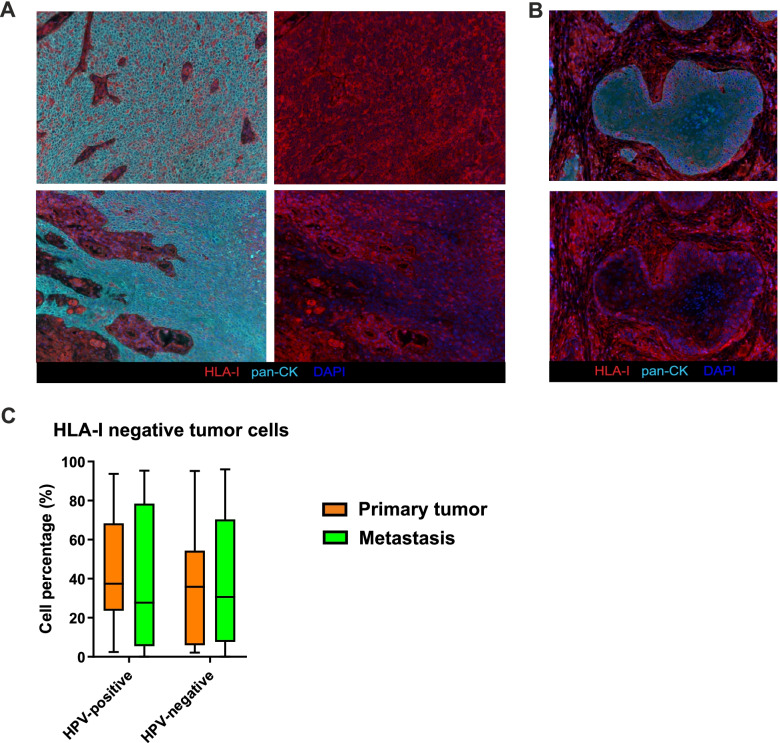
HLA-I expression assessment. A Representative multispectral images highlighting the different HLA-I expression on tumor cells in different areas of a tissue section derived from the same patients. In the left pictures, HLA-I (red), pan-CK (cyan) and DAPI (blue) are represented, while in the right pictures the pan-CK channel is switch off to better visualize the HLA-I down-regulation in tumor cells. Original magnification X20. B Representative multispectral images which highlight the different HLA-I expression on tumor cells at the tumor-stroma interface. In the left picture, HLA-I (red), pan-CK (cyan) and DAPI (blue) are represented, while in the right picture the pan-CK channel is switch off to better visualize the HLA-I down-regulation in the core of tumor nest. Original magnification X20. C Percentage of HLA-I negative tumor cells among the total number of tumor cells in HPV-positive and HPV-negative primary tumors and metastases

