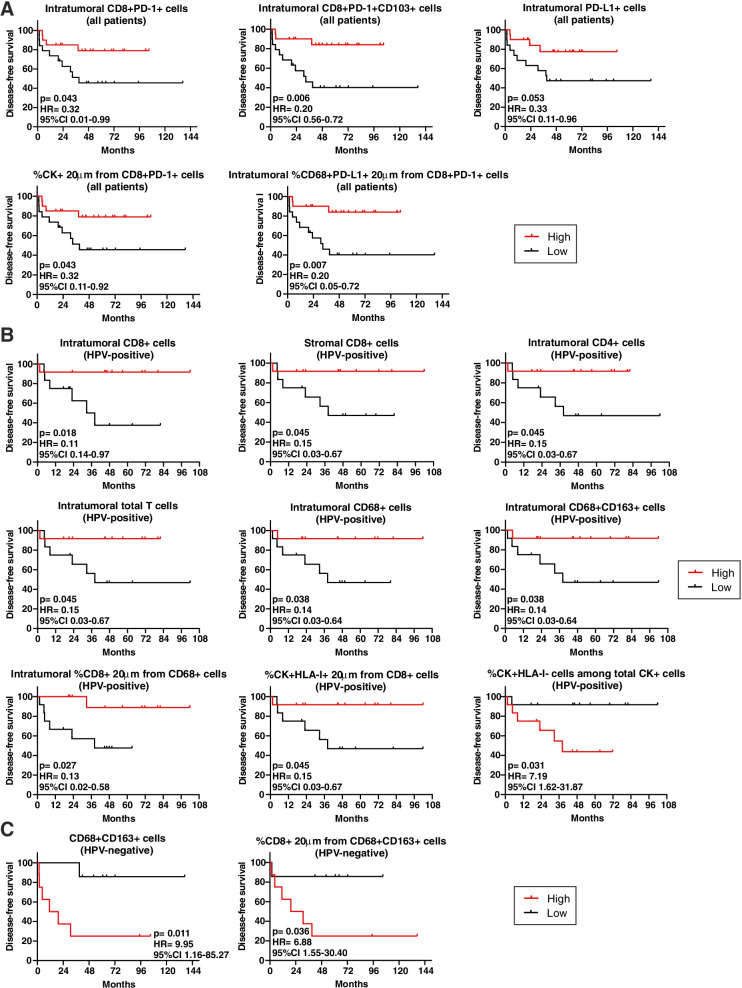
Fig. 8.
The immune cell composition of the primary tumor microenvironment correlates with patient outcome. A-C Kaplan-Meier survival curves for disease-free survival according to the immune cell composition and cell-to-cell interactions of (A) all OPSCC (n = 39), (B) HPV-positive (n = 24) and (C) HPV-negative (n = 15) primary tumors. The median cut-off of each immune cell subset density and percentage was used to separate high and low infiltrated groups. Log-rank p values, hazard ratios (HR) and 95% confidence intervals (CI) are reported in each graph

