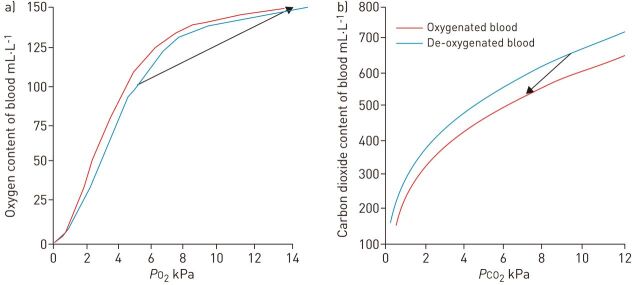
Figure 4.
Oxygen uptake and carbon dioxide removal in the membrane lung. a) The oxygen dissociation curve for blood. b) The carbon dioxide dissociation curve for blood. The arrow represents the change in gas tension and gas content of blood that typically occurs in the membrane lung. Haemoglobin: 110 g·L−1. PO2: oxygen tension; PCO2: carbon dioxide tension.

