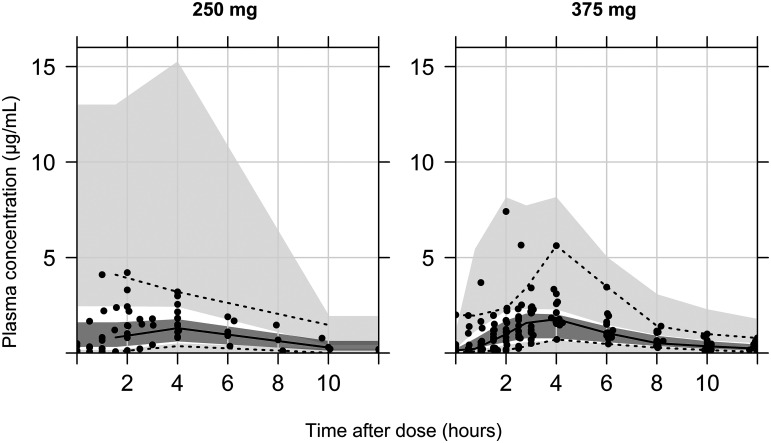
FIG 2.
Visual predictive check (VPC) plot of final population pharmacokinetics model for prothionamide (PTO), stratified on dosing regimen (250 mg and 375 mg). Solid line, median for observation; top and bottom dashed lines, 95th and 5th percentiles for observation, respectively; gray blocks, median prediction with 95% confidence interval (CI); top and bottom light gray blocks, 95th and 5th predictions with 95% CI, respectively.

