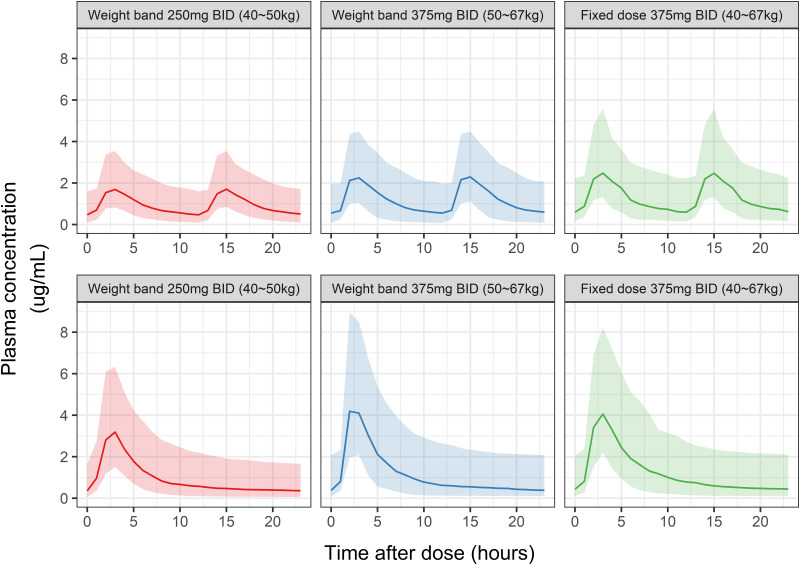
FIG 3.
Simulation pharmacokinetic profiles for prothionamide (PTO) at steady state after twice-daily (BID, top) and once-daily (QD, bottom) doses. The two panels on the left and middle display profiles for weight-band dose regimens, and the right panel displays the profile for fixed-dose regimen. Line, median; shaded area, 10th to 90th percentiles.

