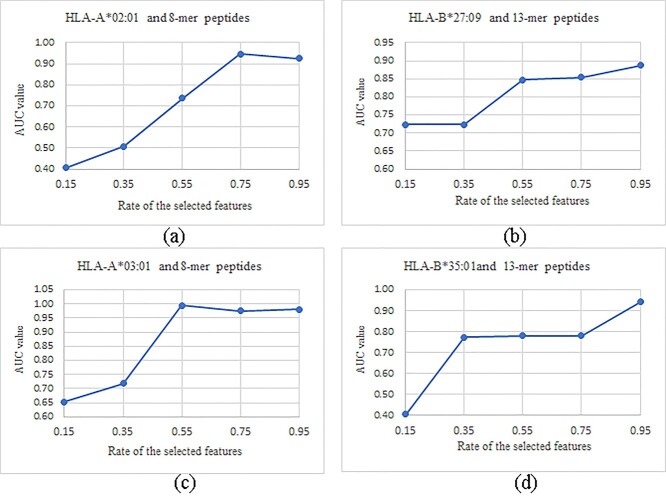
Figure 8.
Evaluation of the different rates of the selected features for the four subtasks. The evaluation experiments were conducted for the prediction tasks of (A) HLA-A*02:01 and 8-mer peptides, (B) HLA-A*03:01 and 8-mer peptides, (C) HLA-B*27:09 and 13-mer peptides and (D) HLA-B*35:01and 13-mer peptides. The horizontal axis gave the five evaluated values, including 0.15, 0.35, 0.55, 0.75 and 0.95. The vertical axis gave the calculated AUC values of the experiments.

