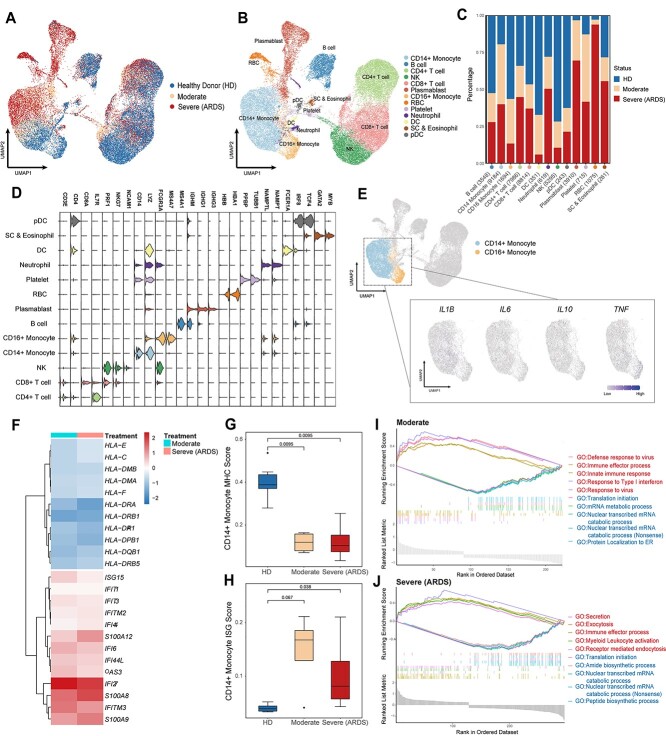
Figure 5.
Peripheral immune cells atlas and inflammatory-related mechanisms in COVID-19 revealed by CLEAR. (A, B) UMAP visualization of the COVID-19 cell atlas (A) colored by COVID status and (B) colored by 13 cell type clusters (n = 43 695 cells). (C) Bar plot showing the relative percentage of different cell types comparing three COVID-19 statuses (HDs, moderate status and severe status). (D) Stacked violin plot overview of the top-important marker genes expression for each cell type. (E) UMAP visualization of the key proinflammatory cytokines expression in both CD14+ and CD16+ monocytes. (F) Heatmap of IFN-stimulated genes and MHC-related genes in CD14+ monocyte. (G, H) Boxplots showing the mean (G) MHC-related score and (H) ISG score in CD14+ monocyte colored by different COVID statuses (HDs—blue, moderate—orange and severe (ARDS)—red). (I, J) GSEA of differential expressed gene (|LogFC| > 0.25) sets between (I) moderate CD14+ monocyte and healthy donor CD14+ monocyte and (J) severe CD14+ monocyte and healthy donor CD14+ monocyte. Red represents upregulated GO biological pathway, and blue represents downregulated GO biological pathway.

