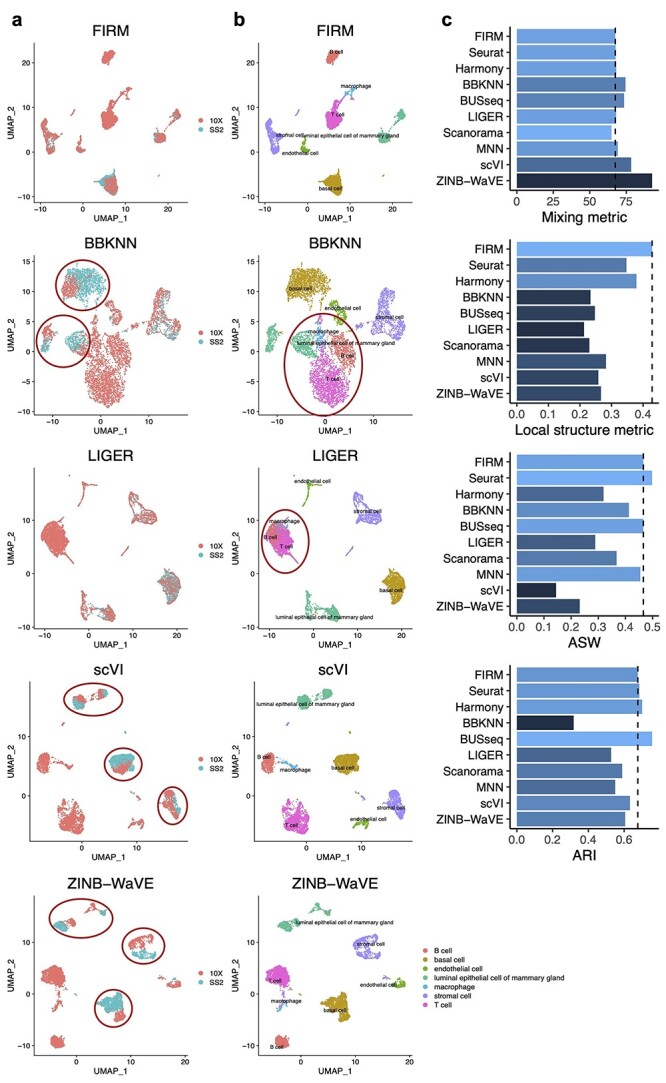
Figure 2.

Comparison of integration methods based on the mammary gland scRNA-seq datasets generated by SS2 and 10X from Tabula Muris. (A and B) UMAP plots of the integrated scRNA-seq dataset colored by platform (A) and by cell type (B) using FIRM, Seurat, BBKNN, BUSseq, LIGER, scVI and ZINB-WaVE. The red circles highlight the problems of the integration results given by these methods. (C) Metrics for evaluating performance across the 10 methods on four properties: cell mixing across platforms (Mixing metric), the preservation of within-dataset local structure (Local structure metric), average silhouette width of annotated subpopulations (ASW) and adjusted rand index (ARI). The color (from light to dark) represents the performance (from the best to the worst). The dashed lines were set at the values for FIRM as reference lines.
