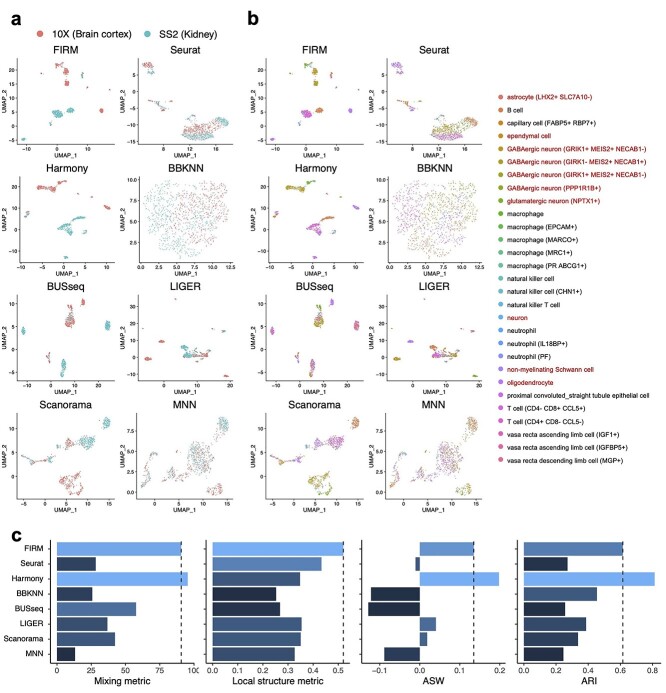
Figure 3.
Comparison of integration methods for scRNA-seq datasets from two tissues in Tabula Microcebus (lemur 2) generated by different platforms (Kidney: SS2, Brain cortex: 10X). For clear illustration, we withheld several cell types in each of the dataset to make the cell types non-overlapped across datasets. (A and B) UMAP plots of scRNA-seq datasets colored by platform (A) and by cell type (B) after integration using FIRM, Seurat, Harmony, BBKNN, BUSseq, LIGER, Scanorama and MNN. The labels for cell types in Brain cortex (10X) are colored by red. (C) Metrics for evaluating performance across the eight methods on four properties: cell mixing across platforms (Mixing metric), the preservation of within-dataset local structure (Local structure metric), average silhouette width of annotated subpopulations (ASW) and adjusted rand index (ARI). The color (from light to dark) represents the performance (from the best to the worst). The dashed lines were set at the values for FIRM as reference lines.

