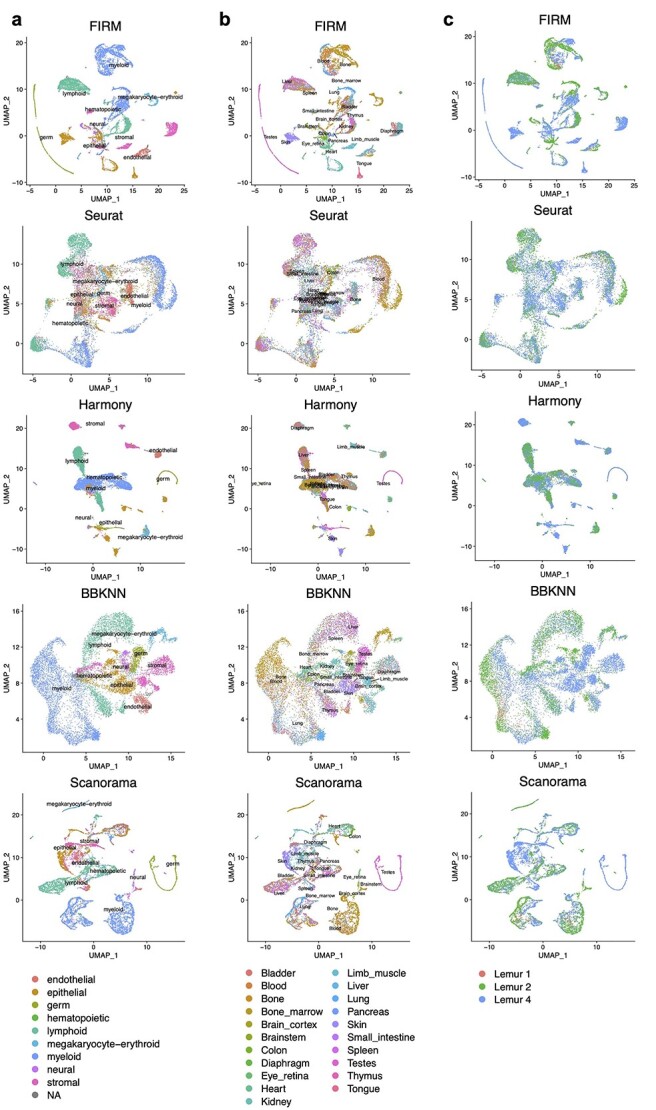
Figure 5.

Comparison of FIRM, Seurat, Harmony, BBKNN and Scanorama for integration of all SS2 datasets across individuals and tissues in Tabula Microcebus. (A–C) UMAP plots of scRNA-seq datasets colored by compartment (A), by tissue (B) and by individual (C) after integration using FIRM, Seurat, Harmony, BBKNN and Scanorama.
