FIG 2.

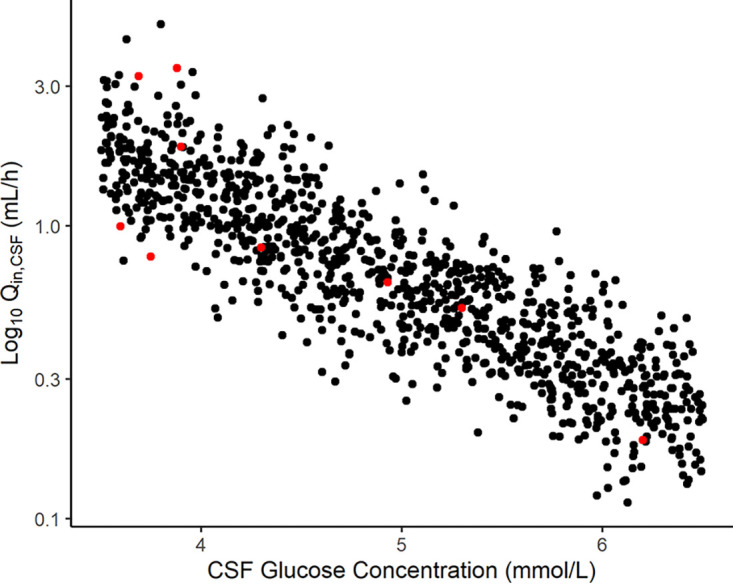
Correlation between intercompartmental clearance into the CSF (Qin) and the CSF glucose concentration. Red circles represent the observed data, and black circles represent the simulated patients.

Correlation between intercompartmental clearance into the CSF (Qin) and the CSF glucose concentration. Red circles represent the observed data, and black circles represent the simulated patients.