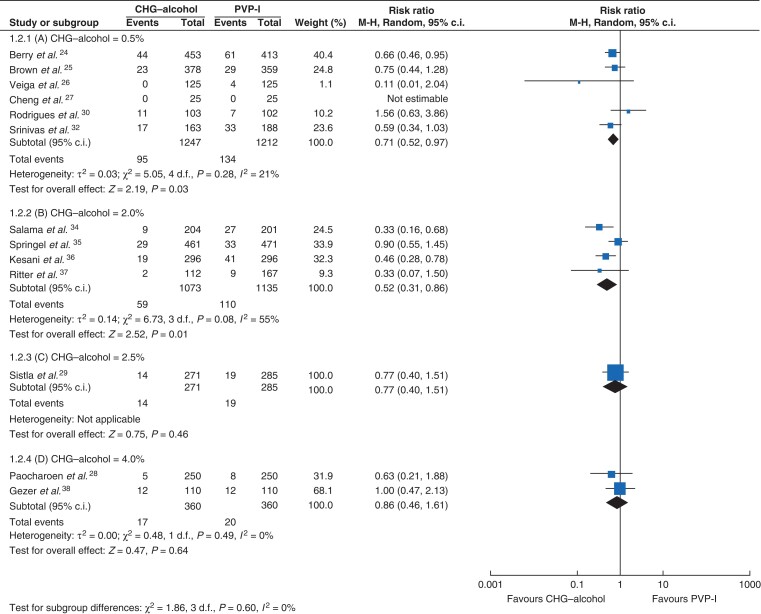
Fig. 4.
Forest plot of subgroup analyses comparing SSI rate among different concentrations ranging from 0.5 per cent to 4.0 per cent CHG–alcohol and PVP-I. (a) CHG–alcohol = 0.5%, (b) CHG–alcohol = 2.0%, (c) CHG–alcohol = 2.5%, (d) CHG–alcohol = 4.0%
Risk ratios are represented by diamond shapes, and 95 per cent confidence intervals (c.i.) are represented by horizontal lines. CHG, chlorhexidine gluconate; PVP-I, povidone-iodine.

