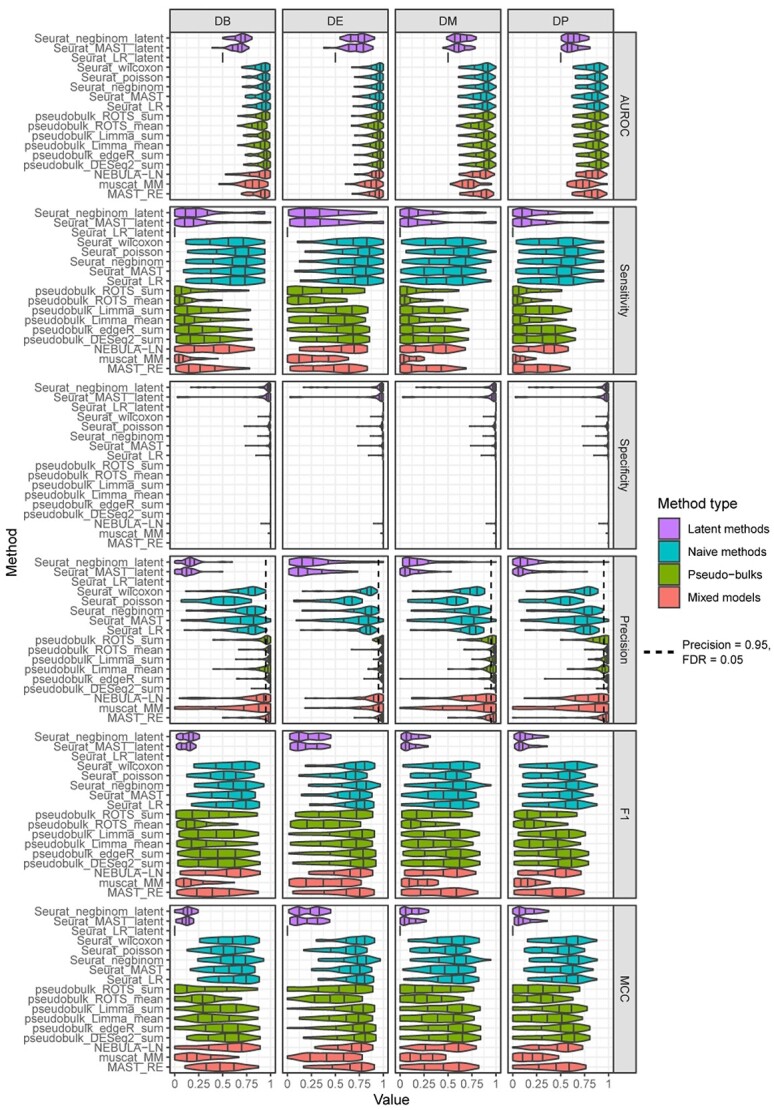
Figure 2.

Results of the simulation based on a reference-based negative binomial generative model. Each box plot includes performance values for 54 cell populations (clusters). The rows signify the four different differential states: changes in both proportions and modality (DB), changes in the mean expression (DE), differential modality (DM) and changes in the proportions of low and high expression-state components (DP). The columns group the results by the four different performance metrics: Area under the receiver operating characteristic (AUROC) curve, sensitivity, specificity and precision. Seurat_poisson_latent was left out from the results due to its high failure rate for the simulation.
