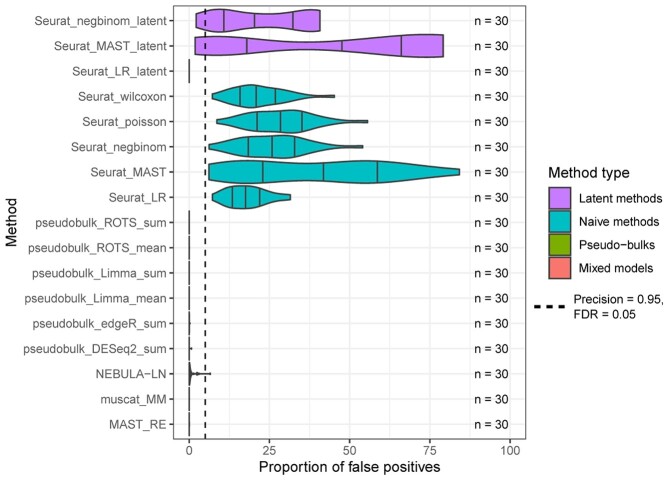
Figure 4.
Mock analysis using real data to estimate the proportion of false positives. The mock analysis was performed by segregating good-quality B cells from a COVID-19 dataset [26] that consists of 14 healthy control subjects and by randomly assigning one of the two mock groups for each subject. The assumption is that no genes with differential states should be found between the random mock groups. The random sampling was repeated 30 times. Seurat_poisson_latent was left out from the results due to its high failure rate (29/30) for the mock data. The dashed vertical line at 5% denotes the expected maximum proportion of false positives with an FDR threshold of 0.05.

