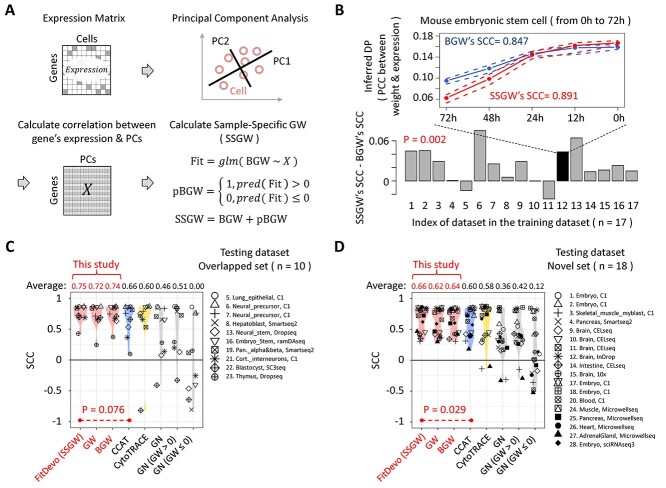
Figure 3.
The calculation of SSGW and the validation of FitDevo. (A) The workflow of calculating SSGW. ‘X’ stands for the gene-PC correlation matrix. ‘glm’ stands for the generalized linear model. ‘pred’ stands for the ‘predict’. (B) The difference between SSGW’s SCCs and BGW’s SCCs. On the line chart, the upper dot-line, middle line and lower dot-line are the 75%, 50% and 25% quantile of the inferred DP (PCC between GW and gene expression), respectively. (C) and (D) show the comparison results using overlapped (overlapped with training dataset) and novel testing samples, respectively. We name the method of using SSGW as FitDevo. We only compare FitDevo with CCAT and CytoTRACE as they have better performance than other methods [20, 21]. Considering the testing dataset only has cells with starting and ending labels, following the study of CCAT, we also use the AUC to measure the performance (Supplementary Figure 11).

