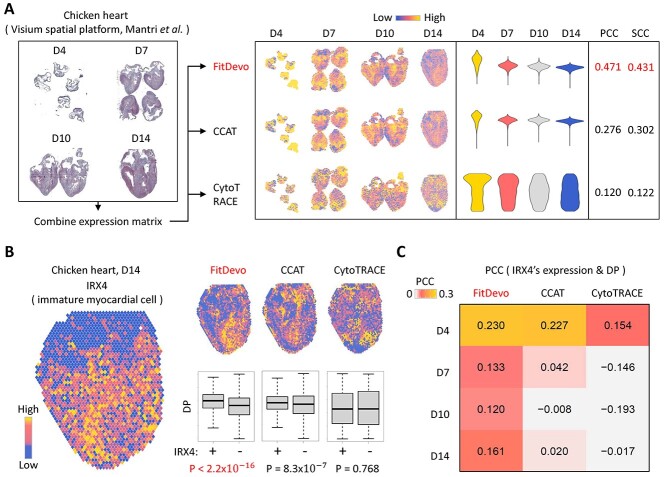
Figure 5.
The spatial transcriptomic data analysis of hearts. (A) The data analysis workflow with the spatial transcriptomic data of chicken hearts. (B) The expression value of IRX4, a marker for immature myocardial cells [28] and the DP, inferred by FitDevo, CCAT and CytoTRACE, on the spatial image. Results of other markers and developmental stages are provided in Supplementary Figure 15. (C) The correlation between the expression of IRX4 and the DP inferred by FitDevo, CCAT and CytoTRACE. ‘D4’, ‘D7’, ‘D10’ and ‘D14’ stand for ‘Day4’, ‘Day7’, ‘Day10’ and ‘Day14’, respectively.

