Figure 6.
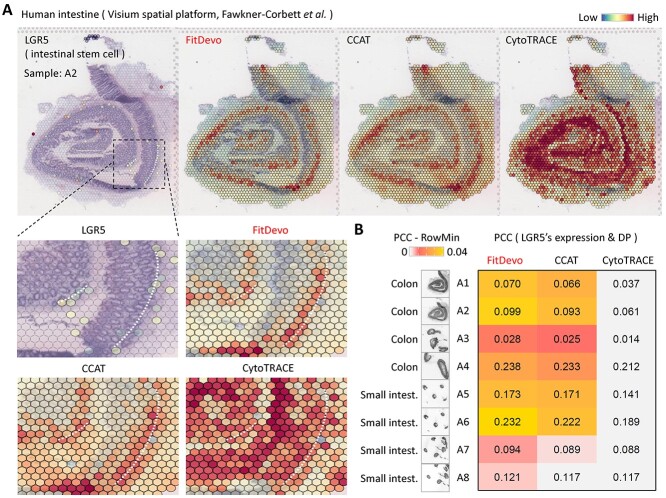
The spatial transcriptomic data analysis of intestines. (A) The expression value of LGR5, a marker for intestinal stem cells [38, 39], and the DP, inferred by FitDevo, CCAT and CytoTRACE, on the spatial image of the human intestine (A2). The results of other samples are shown in Supplementary Figure 16. We use the white dot-line to indicate the potential layer of intestinal stem cells. (B) The correlation between the expression of LGR5 and the DP inferred by FitDevo, CCAT and CytoTRACE. ‘RowMin’ stands for the minimum value of each row.

