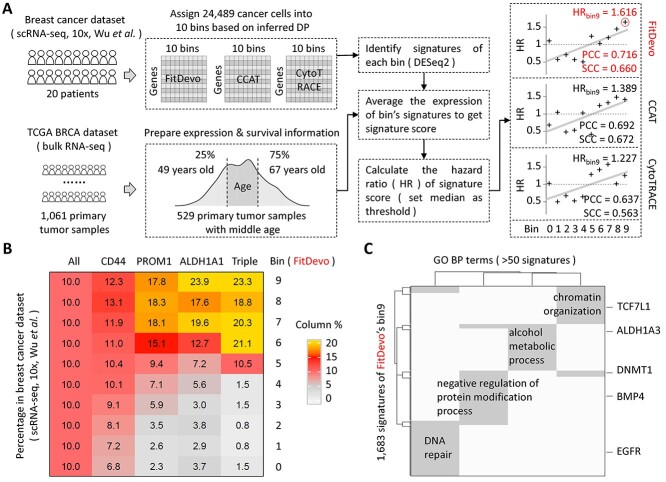
Figure 7.
The developmental potential analysis of breast cancer. (A) The workflow of DP analysis with the scRNA-seq and TCGA bulk data of breast cancer. Data from patients with middle age (>49 and < 67 years old) are selected to analyze. We use DESeq2 to identify the signatures of each bin. We use DESeq2 [52] to identify signatures of each bin in the scRNA-seq data of breast cancer. Because the computational efficiency of DESeq2 is low when dealing with tens of thousands of single cells, we generate pseudo-bulk samples to improve the efficiency. Firstly, we merge all 24 489 cancer cells into 2450 pseudo-bulk samples by aggregating the read counts of neighbor cells. For each bin, we get 245 pseudo-bulk samples (around 10 cells per pseudo-bulk sample). Then, we use DESeq2 to get signatures of each bin by comparing the expression values between the given bin and other bins. The cutoffs of foldchange, adjusted P-value and baseMean are 2, 0.05 and 0.5, respectively. Considering the generation of pseudo-bulk sample requires a random seed when defining neighbor cells, we therefore use three different random seeds to generate three sets of signatures and define the bin’s signatures as the intersection of those three sets. (B) The percentage of the marker gene (CD44, PROM1 and ALDH1A1) positive cells in each bin of FitDevo. ‘ALL’ indicates the percentage of all cells in each bin. The sum of each column is 100. ‘Triple’ stands for triple-positive (CD44, PROM1 and ALDH1A1) cells. Results of other markers are provided in Supplementary Figure 17. (C) The gene set (GO BO) enrichment results with the signatures of FitDevo’s bin9. ‘GO’ and ‘BP’ stand for gene ontology and biological process, respectively. We only show the terms covering > 50 signatures of FitDevo’s bin9.

