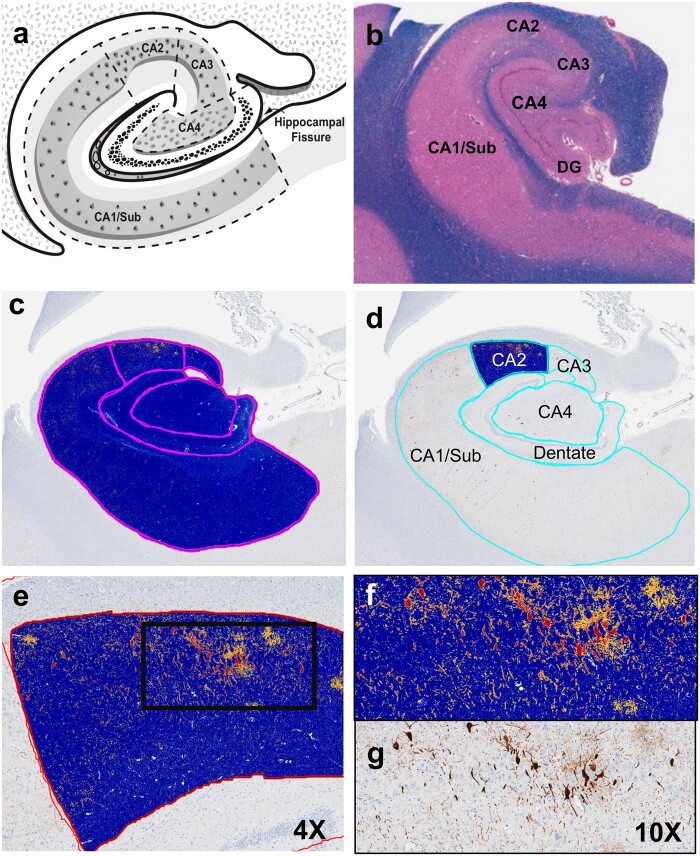
FIGURE 1.
Neuroanatomical segmentation strategy and p-tau burden quantification. (a) Schematic illustrating the hippocampal subregions. (b) Representative Luxol fast blue-counterstained hematoxylin and eosin section (LH&E) from a control showing the hippocampal subregions. (c) Example of a fully segmented hippocampal formation following application of the positive pixel algorithm. (d) Example of quantification of the positive pixel count algorithm in CA2. (e) Higher-power images of CA2 are shown at 4× (f, g) as well as 10× showing that the pixel thresholds capture intracellular tangles (red) threads and dots (orange and yellow). The example case shown above had a diagnosis of PART.

