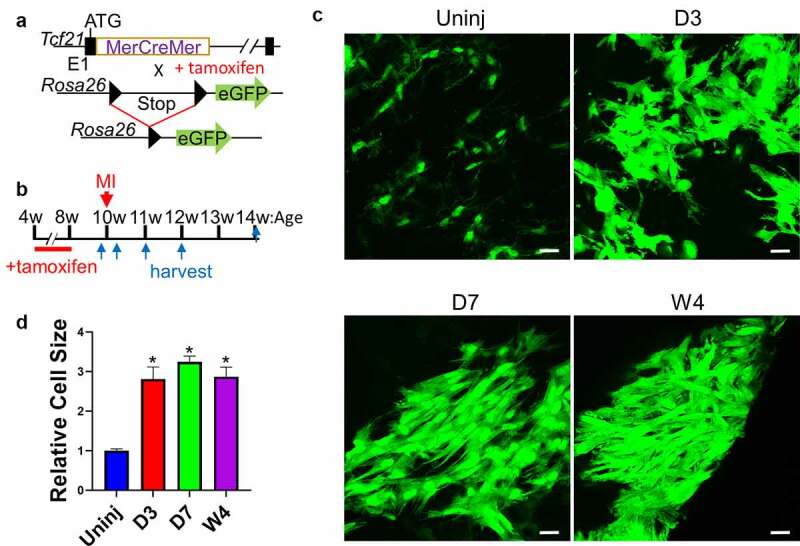
Figure 1.

Lineage-tracing of cardiac fibroblast after MI.
(a) Schematic of the Tcf21MCM/+; R26eGFP mouse line. (b) Experimental scheme whereby Tcf21MCM/+; R26eGFP mice were treated with TM subjected to MI surgery, and then euthanized for heart sample collection at different time points after MI. (c-d) Whole-mount confocal microscopy images showing Tcf21 lineage-traced cardiac fibroblasts (GFP+) in the uninjured myocardium and the infarct at indicated time points after MI (C). d shows the relative sizes of cardiac fibroblasts at indicated time points. Data are shown as mean ± SEM (n = 3). *P < 0.05 vs uninjured, one-way ANOVA with multiple comparisons. Scale bar = 10 µm. Uninj, uninjured; D3, day 3; D7, day 7; W4, week 4.
