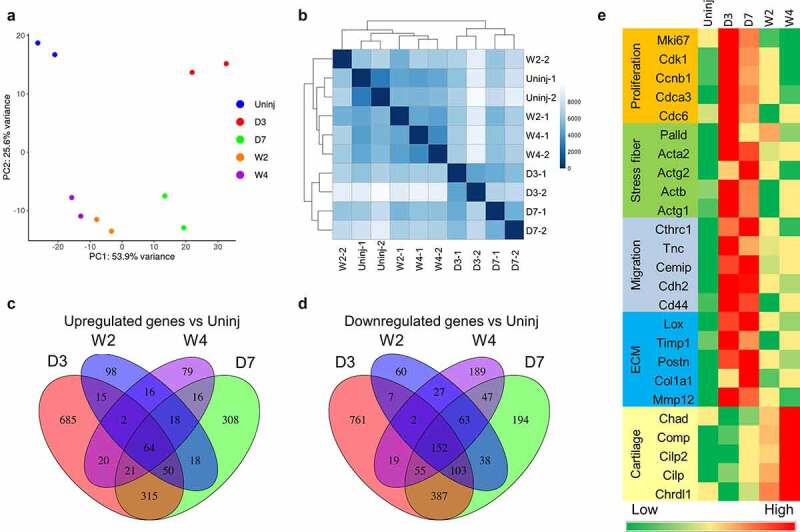
Figure 2.

RNA-seq analysis of cardiac fibroblasts of different differentiation states.
Tcf21 lineage-traced cardiac fibroblasts were sorted from the uninjured myocardium and the infarct at different time points after MI for RNA-seq analysis. (a-b) PCA analysis (a) and Poisson distance analysis (b) of RNA-seq data showing tight clustering of repeats of each group. (c-d) Venn diagram showing the overlaps between genes that were differentially expressed between Tcf21 lineage–traced fibroblasts isolated from the uninjured myocardium and those from the infarct at different time points after MI. Genes that were upregulated after MI compared to cardiac fibroblasts isolated from the uninjured myocardium are shown in C. Downregulated genes are shown in D. (e) Heat maps showing the normalized gene expression of some representative genes in different categories. Uninj, uninjured; D3, day 3; D7, day 7; W2, week 2; W4, week 4.
