Figure 4.

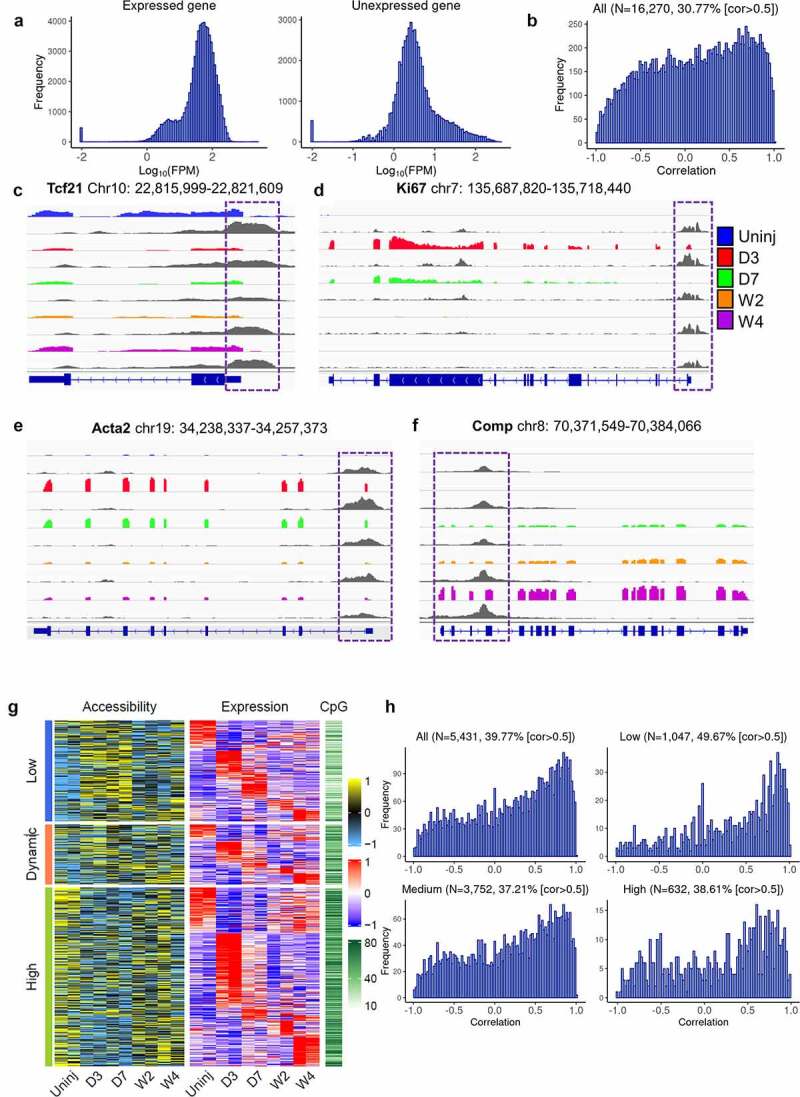
Differential gene expression and corresponding changes in promoter accessibility among cardiac fibroblasts of different differentiation states.
(a) Histograms of promoter accessibility of genes that were expressed (left) and unexpressed (right) in cardiac fibroblasts measured by ATAC-seq. (b) Histogram of correlation between promoter accessibility and expression of all genes that have ATAC-seq reads mapped to their promoters and mapped RNA-seq reads. The percentage of genes with cor > 0.5 is indicated. (c-f) Integrated Genome Viewer (IGV) views of the RNA-seq data and ATAC-seq data of representative genes showing differential gene expression and promoter accessibility among Tcf21 lineage-traced cardiac fibroblasts isolated from the uninjured myocardium and the infarct at different time points after injury. Promoter regions are highlighted in purple boxes. Coloured tracks are RNA-seq data, followed by ATAC-seq tracks (grey) of the same sample groups. (g) Heat map showing the promoter accessibility (Z-score), expression level (Z-score), and promoter CpG density of genes that were differentially expressed among cardiac fibroblasts isolated at different time points. Genes were divided into three groups based on their promoter accessibility (low, dynamic, and high). The data for accessibility and expression were standardized such that each row (i.e., promoter/gene) has a mean of 0 and a standard deviation of 1 (Z-score). (h) Histograms of correlations between promoter accessibility and expression level of all differentially expressed genes and their subgroups are classified according to average promoter CpG density, low, medium, and high. Percentages of genes with cor > 0.5 are indicated. Uninj, uninjured; D3, day 3; D7, day 7; W2, week 2; W4, week 4.
