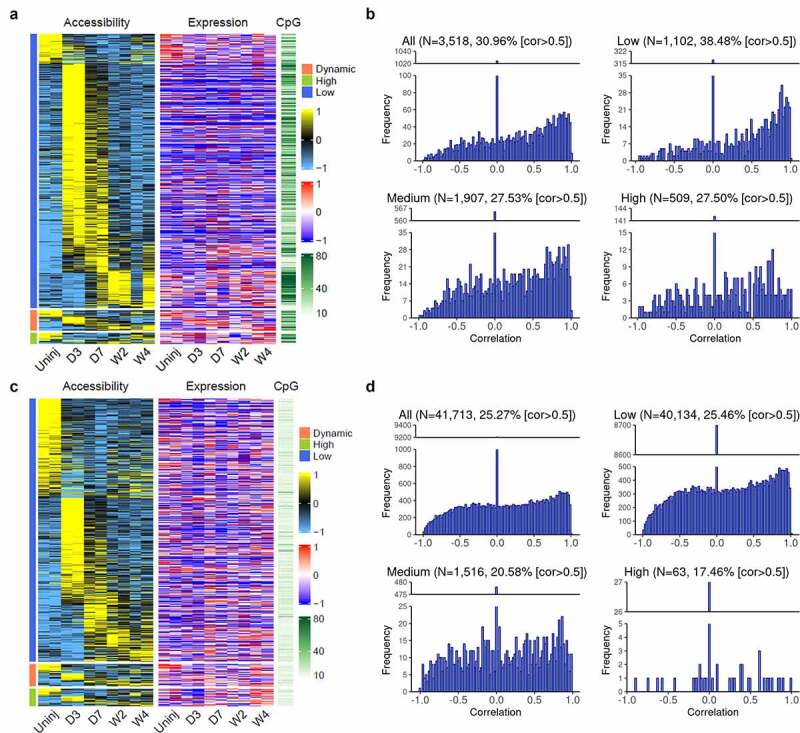
Figure 5.

Differential accessibility in the promoter and distal regions and corresponding gene expression changes among cardiac fibroblasts of different differentiation states.
(a) Heat map showing the accessibility (Z-score) and CpG density of promoters that had differential accessibility among Tcf21 lineage-traced cardiac fibroblasts isolated from the uninjured myocardium and those isolated from the infarct at different time points after MI, together with the expression level (Z-score) of corresponding genes. Promoters were divided into three groups based on the expression of their corresponding genes (low, dynamic, and high). The data of accessibility and expression were standardized such that each row has a mean of 0 and a standard deviation of 1 (Z-score). (b) Histogram of correlation between accessibility and expression level of corresponding genes of all differentially accessible promoters and those with low, medium, and high CpG densities. Percentages of genes with cor > 0.5 are indicated. (c) Heat maps showing the accessibilities and CpG density of distal regions that had differential accessibility among Tcf21 lineage-traced cardiac fibroblasts isolated from the uninjured myocardium and those isolated from the infarct at different time points after MI, together with the expression level of proximal genes. Distal peaks were divided into three groups based on the expression of their proximal genes (low, dynamic, and high). The data of accessibility and expression were standardized such that each row has a mean of 0 and a standard deviation of 1 (Z-score). (d) Histogram of correlation between accessibility and expression level of proximal genes of all differentially accessible distal regions and those with low, medium, or high CpG densities. Percentages of genes with cor > 0.5 are indicated. Uninj, uninjured; D3, day 3; D7, day 7; W2, week 2; W4, week 4.
