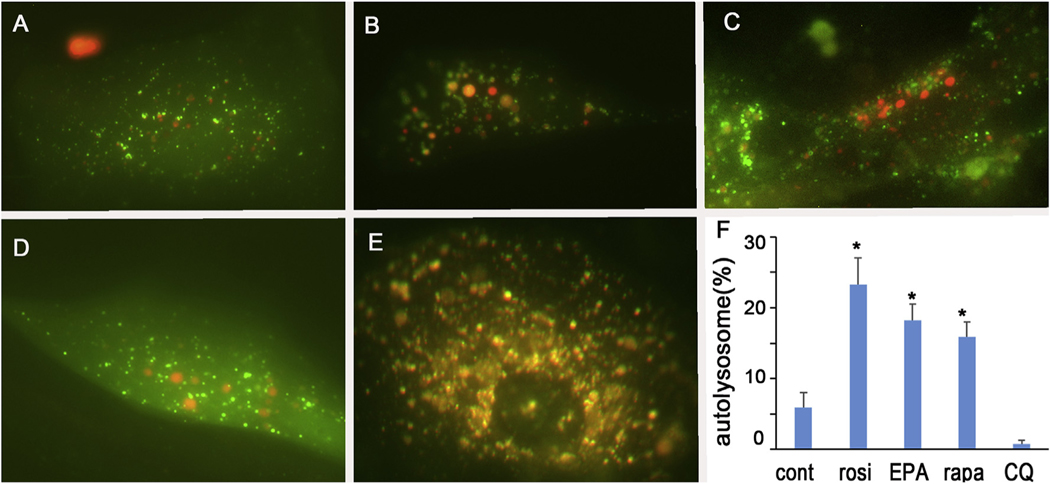
Fig. 7.
Effect of PPARγ activation on autophagic flux in hMGEC. (A-E) Autophagy was monitored after transduction with autophagy tandem RFP-GFP-LC3B sensor. (A) hMGECs were cultivated with DMEM/F12/EGF, (B) exposed to rosiglitazone, (C) to EPA, (D) to rapamycin, and (E) to chloroquine. Autophagosomes were imaged as yellowish green, whereas autolysosomes were imaged as red. (H) Bar graph showing relative percentage of autolysosome to total LC3B dots per cell, indicating autophagic flux (*: P < 0.05).

