
FIGURE 3.
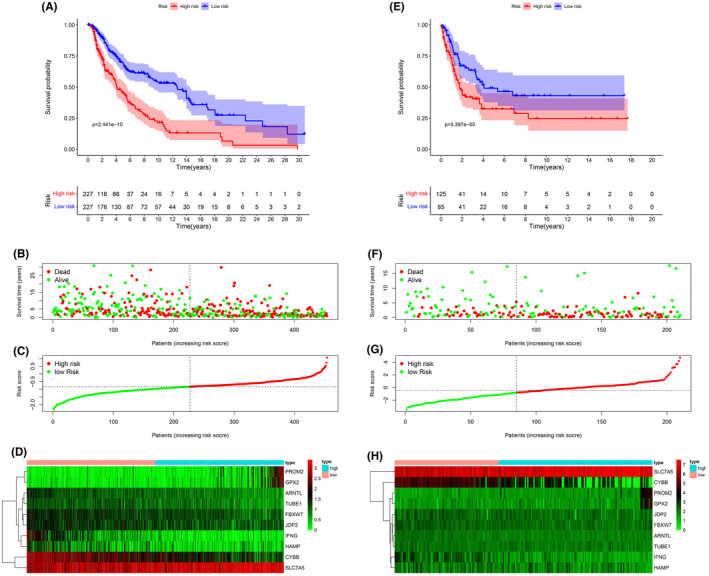
Kaplan–Meier curves for overall survival in the high‐risk and low‐risk groups. (A) The training dataset, (E) validation dataset. The survival status, risk score distribution, and risk genes expression in the datasets. (B, C, D) Training dataset, (F, G, H) validation dataset. (green and red lines/dots represent low and high risk, respectively)