
FIGURE 4.
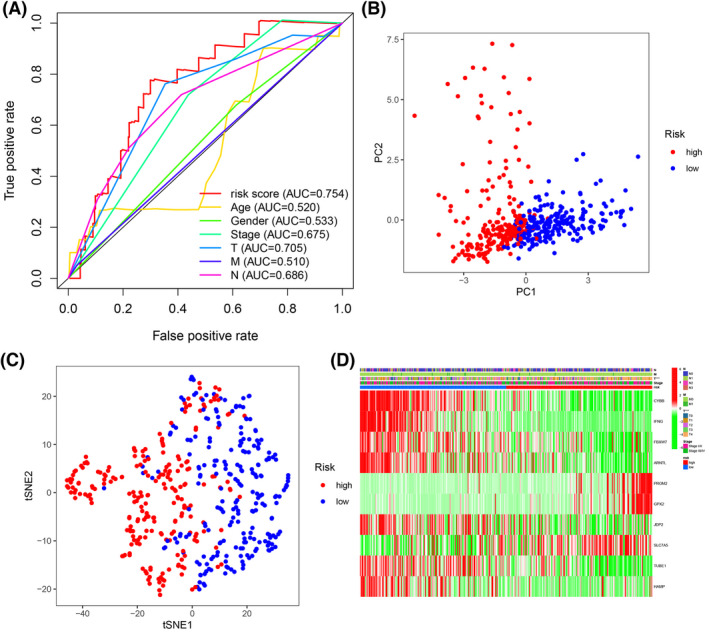
(A) The AUC for risk score and clinical features according to the ROC curves in the training dataset. Clinical feature: Age, gender, stage, and T, N, M stage. (B) PCA plot of the training dataset. (C) The t‐SNE analysis of the training dataset. (D) The differential expression of ferroptosis‐related genes in different clinical features. ***p < 0.001