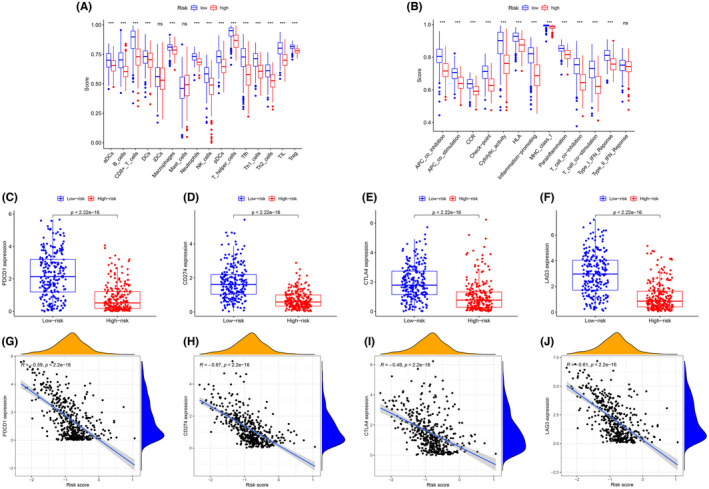
FIGURE 8.

Comparison of the immune cell subpopulations and related functions between the different risk groups: (A) Scores of the 16 immune cells and (B) Scores of the 13 immune‐related functions. (C–F) The comparison of the expression levels of PDCD1 (PD‐1), CD274 (PD‐L1), CTLA‐4, and LAG‐3 between high‐risk and low‐risk groups. (G–J) Significant negative association between the risk score and ICB receptors PDCD‐1 (R = −0.59, p < 0.001, H), CD247 (R = −0.67, p < 0.001), CTLA4 (R = −0.49, p < 0.001), and LAG3 (R = −0.61, p < 0.001). *p < 0.05, **p < 0.01, ***p < 0.001, ns, no significance
