
Table 3.
Risk of bias graph: review authors’ judgments about each risk of bias item presented as percentages across all included RCTs a.
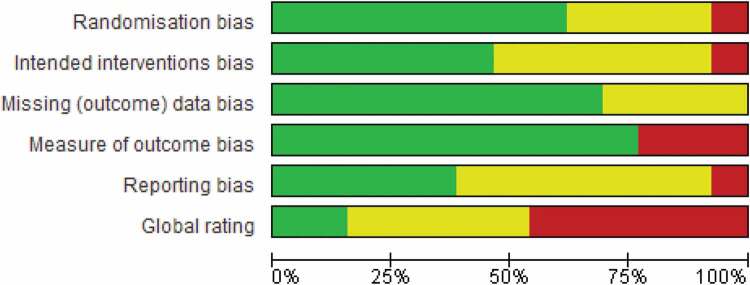 |
aInterpretation:  = Low risk of bias;
  = Moderate risk of bias;
  = High risk of bias
Official websites use .gov
A
.gov website belongs to an official
government organization in the United States.
Secure .gov websites use HTTPS
A lock (
) or https:// means you've safely
connected to the .gov website. Share sensitive
information only on official, secure websites.
Risk of bias graph: review authors’ judgments about each risk of bias item presented as percentages across all included RCTs a.
|
aInterpretation: = Low risk of bias; = Moderate risk of bias; = High risk of bias