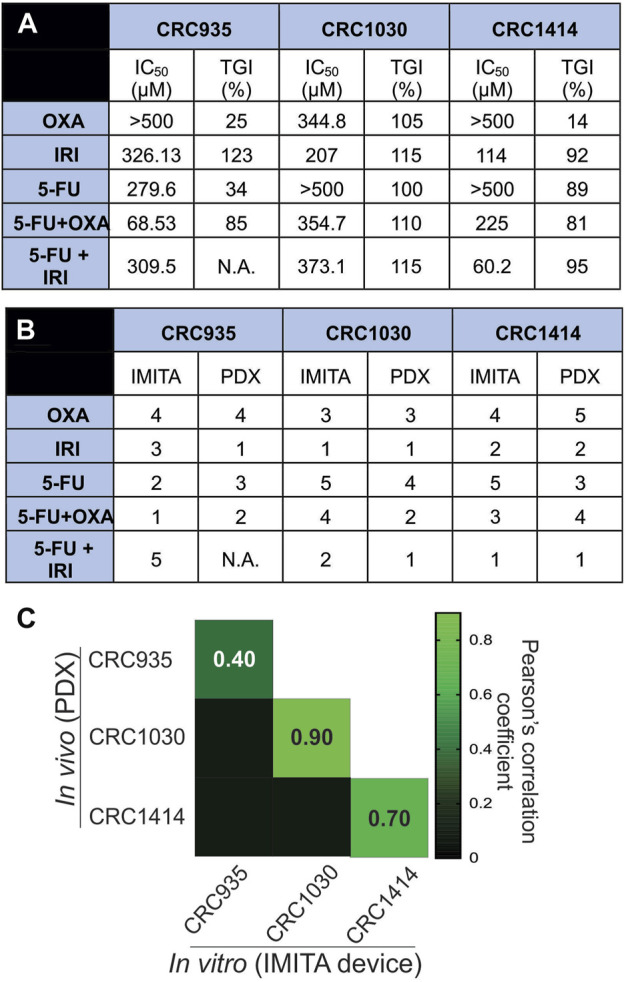
FIGURE 5.

In vitro-in vivo drug response correlation. (A) TGI values from in vivo PDX models and IC50 values of dose response curves obtained from in vitro IMITA devices for 3 CRC patients. (B) Patient-specific drug efficiency ranking using in vivo PDX models and estimated IC50 values using the IMITA device. Rank 1 denotes most effective drugs (lower IC50 values for IMITA and higher TGI% for PDX). (C) Pearson correlation matrix comparing drug efficacy ranking estimated from the in vivo PDX models to the IC50 values from the in vitro IMITA devices.
