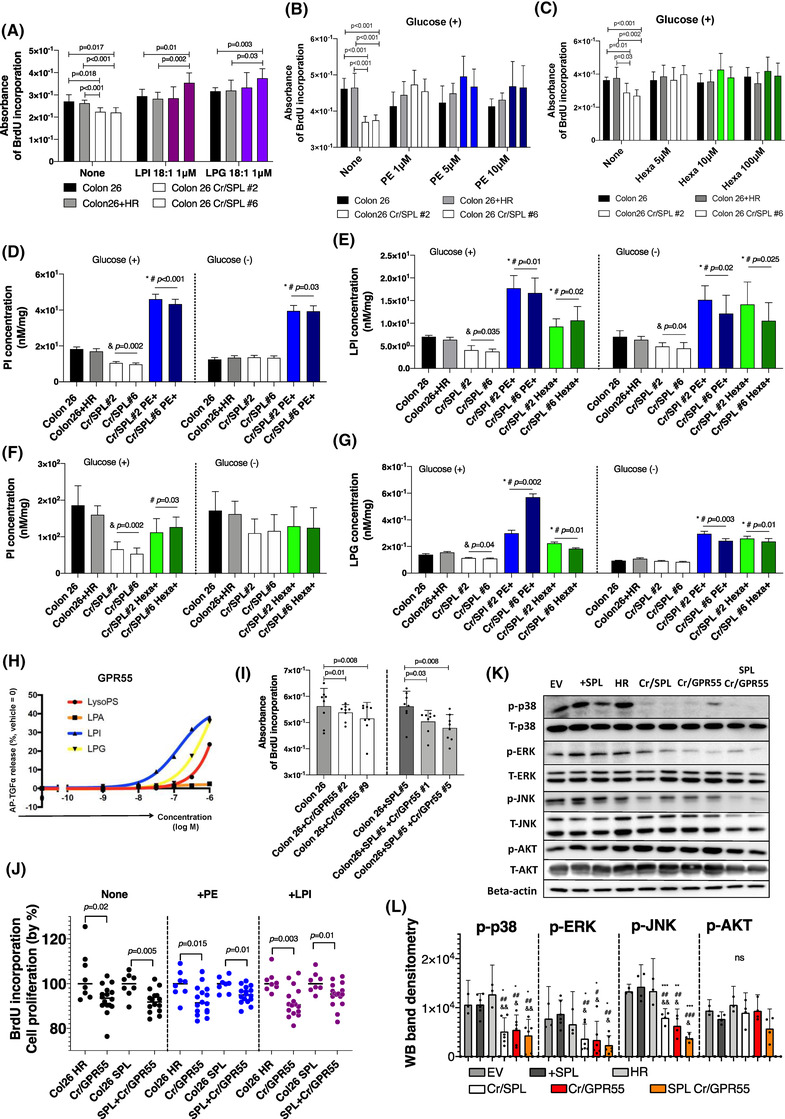
FIGURE 3.

Addition of not only lysophosphatidylinositol (LPI) and lysophosphatidylglycerol (LPG), but also intermediate products of the S1P lyase (SPL)‐mediated metabolic pathway, reversed the retarded cell proliferation in SPL‐inhibited cell lines. (A) Analysis of cell proliferation in SPL‐inhibited cell lines further with the addition of LPI 18:1 or LPG 18:1 at a concentration of 1 μM for 24 h of incubation. Black and gray colour‐filled bars show control cell lines, and white bars show two selected colonies of SPL‐inhibited cell lines, with cherry red indicating the addition of LPI and purple indicating the addition of LPG (N = 8). (B and C) Cell proliferation analysis performed (N = 8) in the SPL‐inhibited cell lines by adding PE (B) and Hexa (C) at three different concentrations under glucose present conditions. (D and F) PI levels were measured by liquid chromatography‐tandem mass spectrometry (LC‐MS/MS) in SPL‐inhibited and control cell lines with or without the addition of PE (5 μM; blue) and Hexa (10 μM; green). (&) indicates the difference between the control and SPL‐inhibited cell lines, (*) indicates the difference between the control, and SPL‐inhibited and PE‐ or Hexa‐added cell lines, (#) indicates the difference between the control, and SPL‐inhibited and PE‐ or Hexa‐added cell lines; p < .05. (E and G) The same cells in Figure 3D and 3F were used for the measurements of the total LPI and LPG. (&) indicates the difference between the control and SPL‐inhibited cell lines, (*) indicates the difference between the control, and SPL‐inhibited and PE‐ or Hexa‐ added cell lines, (#) indicates the difference between SPL inhibited cell lines without PE/Hexa addition, and SPL‐inhibited and PE‐ or Hexa‐ added cell lines. (H) alkaline phosphatase transforming growth factor‐α (AP‐TGFα) release responses of GPR55 to glycero‐LPLs. A strong response was observed for LPI and LPG. (I) Cell proliferation assay performed in GPR55‐receptor‐inhibited cell lines; left: Colon 26 cell lines; right: SPL‐overexpressing cell lines. Two single‐colony cell lines were used for two different sets of experiments. Gray and dark gray bars represent control cell lines without GPR55 inhibition, white and light gray bars represent GPR55‐inhibited cell lines (N = 8). (J) Cell proliferation assays performed in three different cell lines (N = 16) and control cell lines (N = 8) when PE (5 μM, blue dots) and LPI 18:1 (1 μM, cherry red dots) were added. (K) Western blotting (WB) analysis of total and phosphorylated AKT, JNK, ERK, p38, and beta‐actin in cell lines with different expression levels of SPL and GPR55, including control cell lysates. (L) Quantification of WB by densitometry using the NIH ImageJ. WB bands from three repeats of the same set of samples were used, and the phosphorylation rates were quantified. (*) indicates differences with EV, (#) indicates differences with SPL overexpressing cell line, (&) indicates differences with HR. (*), (#), (&): p < .05; (**), (##), (&&): p < .01; (***), (###), (&&&): p < .001. Differences between the two groups were statistically analysed using the unpaired Student's t‐test, and differences more than two groups were analysed using one‐way ANOVA. EV, empty vector transfected control cell line; HR, homologous recombination vector only transfected control cell line; +SPL, SPL overexpressing cell line; Cr/SPL, SPL knock out cell lines by using CRIPR/Cas9 system; Cr/SPL+PE or Hexa, phosphoethanolamine (PE) or hexadecenal (Hexa) added in culture medium of the SPL knock out cell lines by using CRIPR/Cas9 system; Cr/GPR55, GPR55 knock out cell lines by using CRIPR/Cas9 system; SPL+Cr/GPR55, GPR55 knock out cell lines by using CRIPR/Cas9 system in SPL overexpressing cell line
