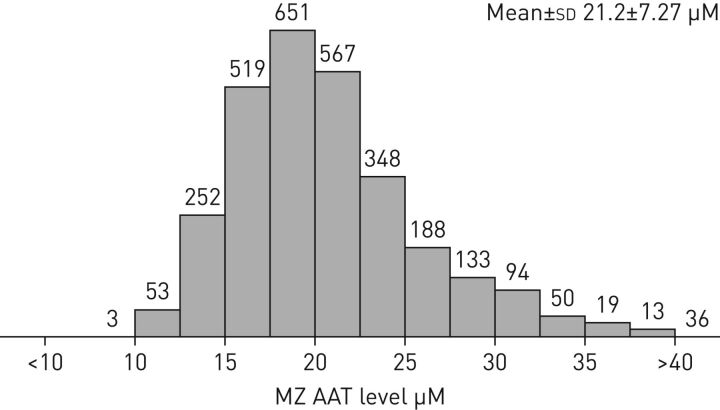
FIGURE 1.
Distribution of alpha-1 antitrypsin (AAT) levels among an MZ cohort (n=2923). Bars and numbers represent subjects with the corresponding level of AAT depicted on the x-axis. Data obtained from the Alpha-1 Coded Testing Study at the Medical University of South Carolina (Charleston, SC, USA) [7].

