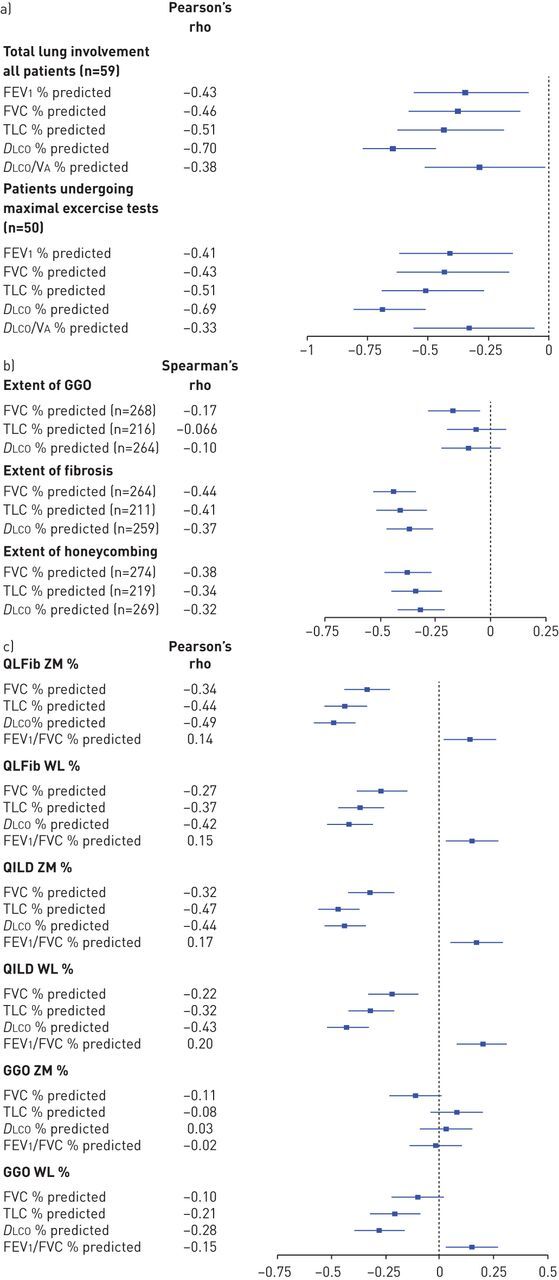
FIGURE 4.

Forest plots of the correlation between high-resolution computed tomography (HRCT) scores and pulmonary function test values. The 95% CIs were calculated using the Fisher transformation. a) In the study by Wells [180] total abnormal lung involvement on HRCT was measured to the nearest 5%, while b) in the study by Zamora [210] the scoring method was not reported. c) Finally, in the study by Tashkin [221], HRCT scans were scored using quantitative imaging analyses and diffusing capacity of the lung for carbon monoxide (DLCO) was corrected for haemoglobin. While the number of subjects included in the analyses was not reported, it was assumed that all 261 systemic sclerosis subjects that underwent HRCT testing were included in the correlation analyses [221]. VA: alveolar volume; FEV1: forced expiratory volume in 1 s; FVC: forced vital capacity; GGO: ground-glass opacity; QILD: quantitative interstitial lung disease; QLFib: quantitative extent of lung fibrosis; TLC: total lung capacity; WL: whole lung; ZM: zone of maximal involvement.
