
Figure 1. Retinal microglia transition to a neurodegenerative MGnD phenotype in glaucoma.
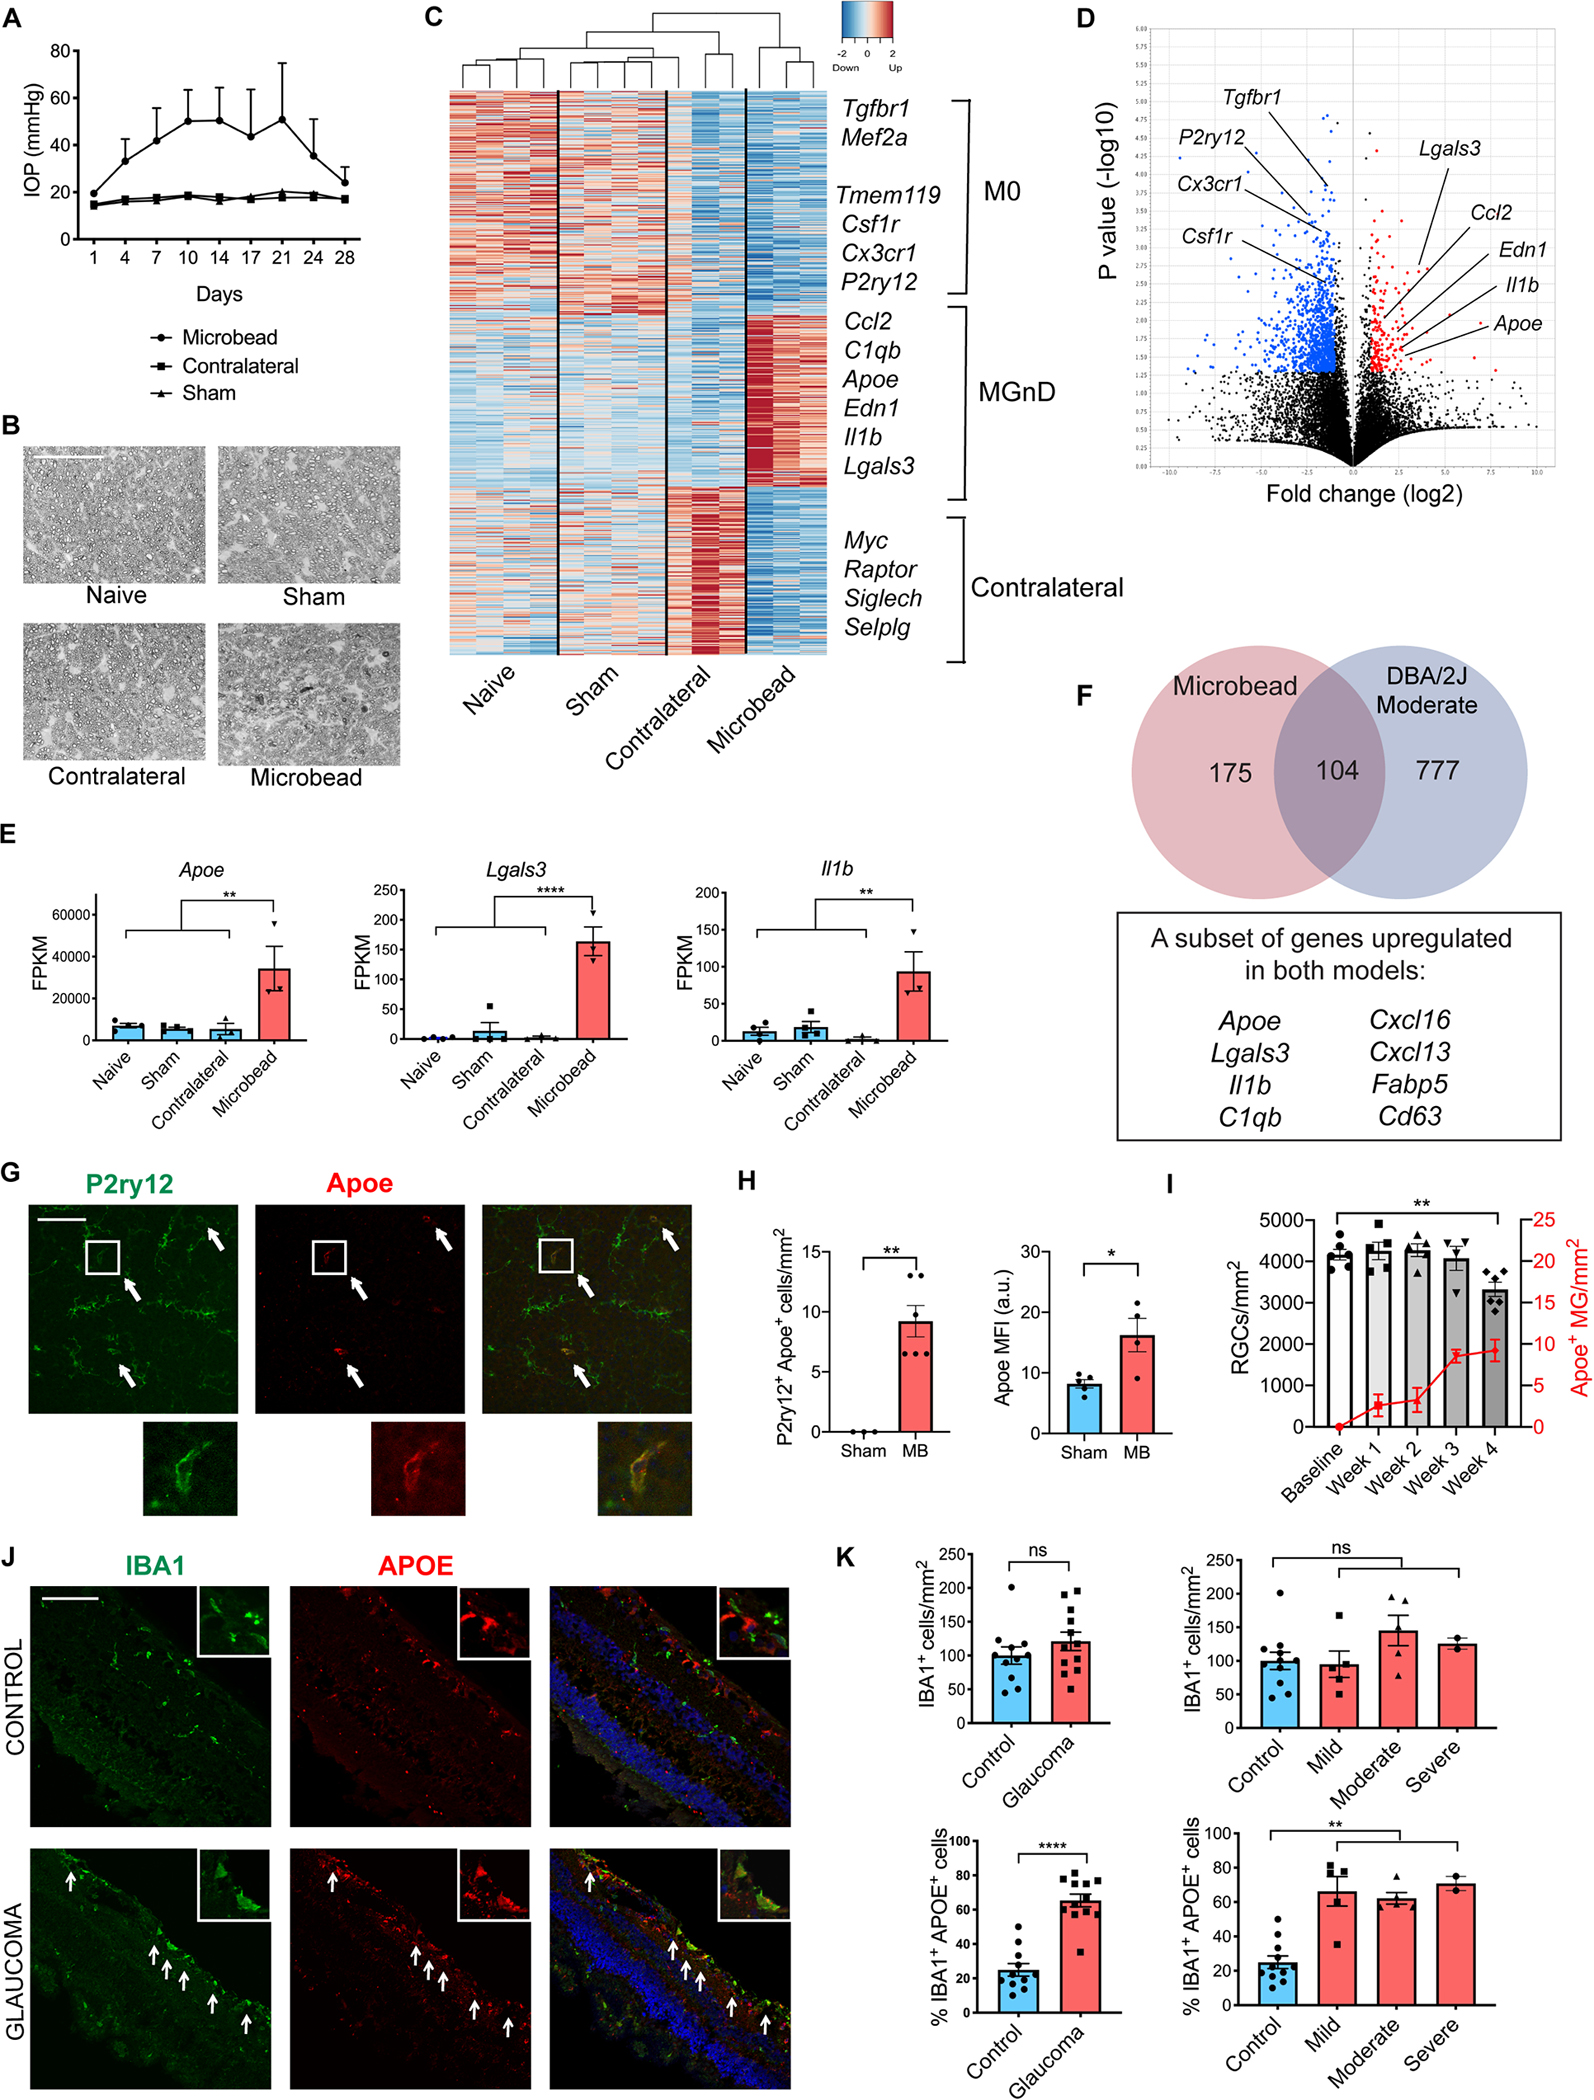
A) Intraocular pressure (IOP) measurements of microbead-injected (MB), contralateral and sham-injected eyes from wildtype C57BL/6J female mice (n=3–4 per group). B) p-phenylenediamine (PPD) staining of optic nerves from MB eyes and controls. Scale bar 50 μm. C) Heatmap of differentially expressed genes between the MB eyes and all three control groups. See also Table S1. D) Volcano plot of differentially expressed genes between MB and sham-injected eyes. Upregulated genes in red; downregulated genes in blue. E) Selected neurodegeneration-associated genes from C. Dot plots showing FPKM values compared using one-way ANOVA. F) Overlap between differentially expressed genes in MB and DBA/2J moderate stage glaucoma eyes. G) Representative images demonstrating colocalization of Apoe and P2ry12 in retinal midperiphery one month after MB injection. Arrows show co-expressing cells. Scale bar 100 μm. H) Quantification of (G). MFI = mean fluorescence intensity of Apoe in P2ry12+ cells. a.u. = arbitrary units. Compared using two-tailed Student’s t-test. I) The time-course of MB-injected wildtype animals showing weekly change in Brn3a+ RGC numbers and P2ry12+ Apoe+ cells per mm2 retina compared using one-way ANOVA (n=4–6 retinas per timepoint). J) Cross-sections of human retinas with and without glaucoma stained with IBA1, APOE, and DAPI. Arrows show co-expressing cells in retinal midperiphery. Scale bar 100 μm. K) Quantification of the number of IBA1+ cells per mm2 of retina and % of IBA1+/APOE+ double-positive cells in control and glaucoma specimens, compared using unpaired t-test with Welch’s correction and one-way ANOVA. Data in A-E and J-K were each obtained from one independent experiment, while data in G-I were pooled from two independent experiments. All results are shown as mean +/− SEM; *P<0.05, **P<0.01, ****P<0.0001, ns = not significant. See also Figures S1 and S2 and Table S1.