
Figure 2. Targeting Apoe in long-lived myeloid cells protects against RGC loss in microbead-induced glaucoma.
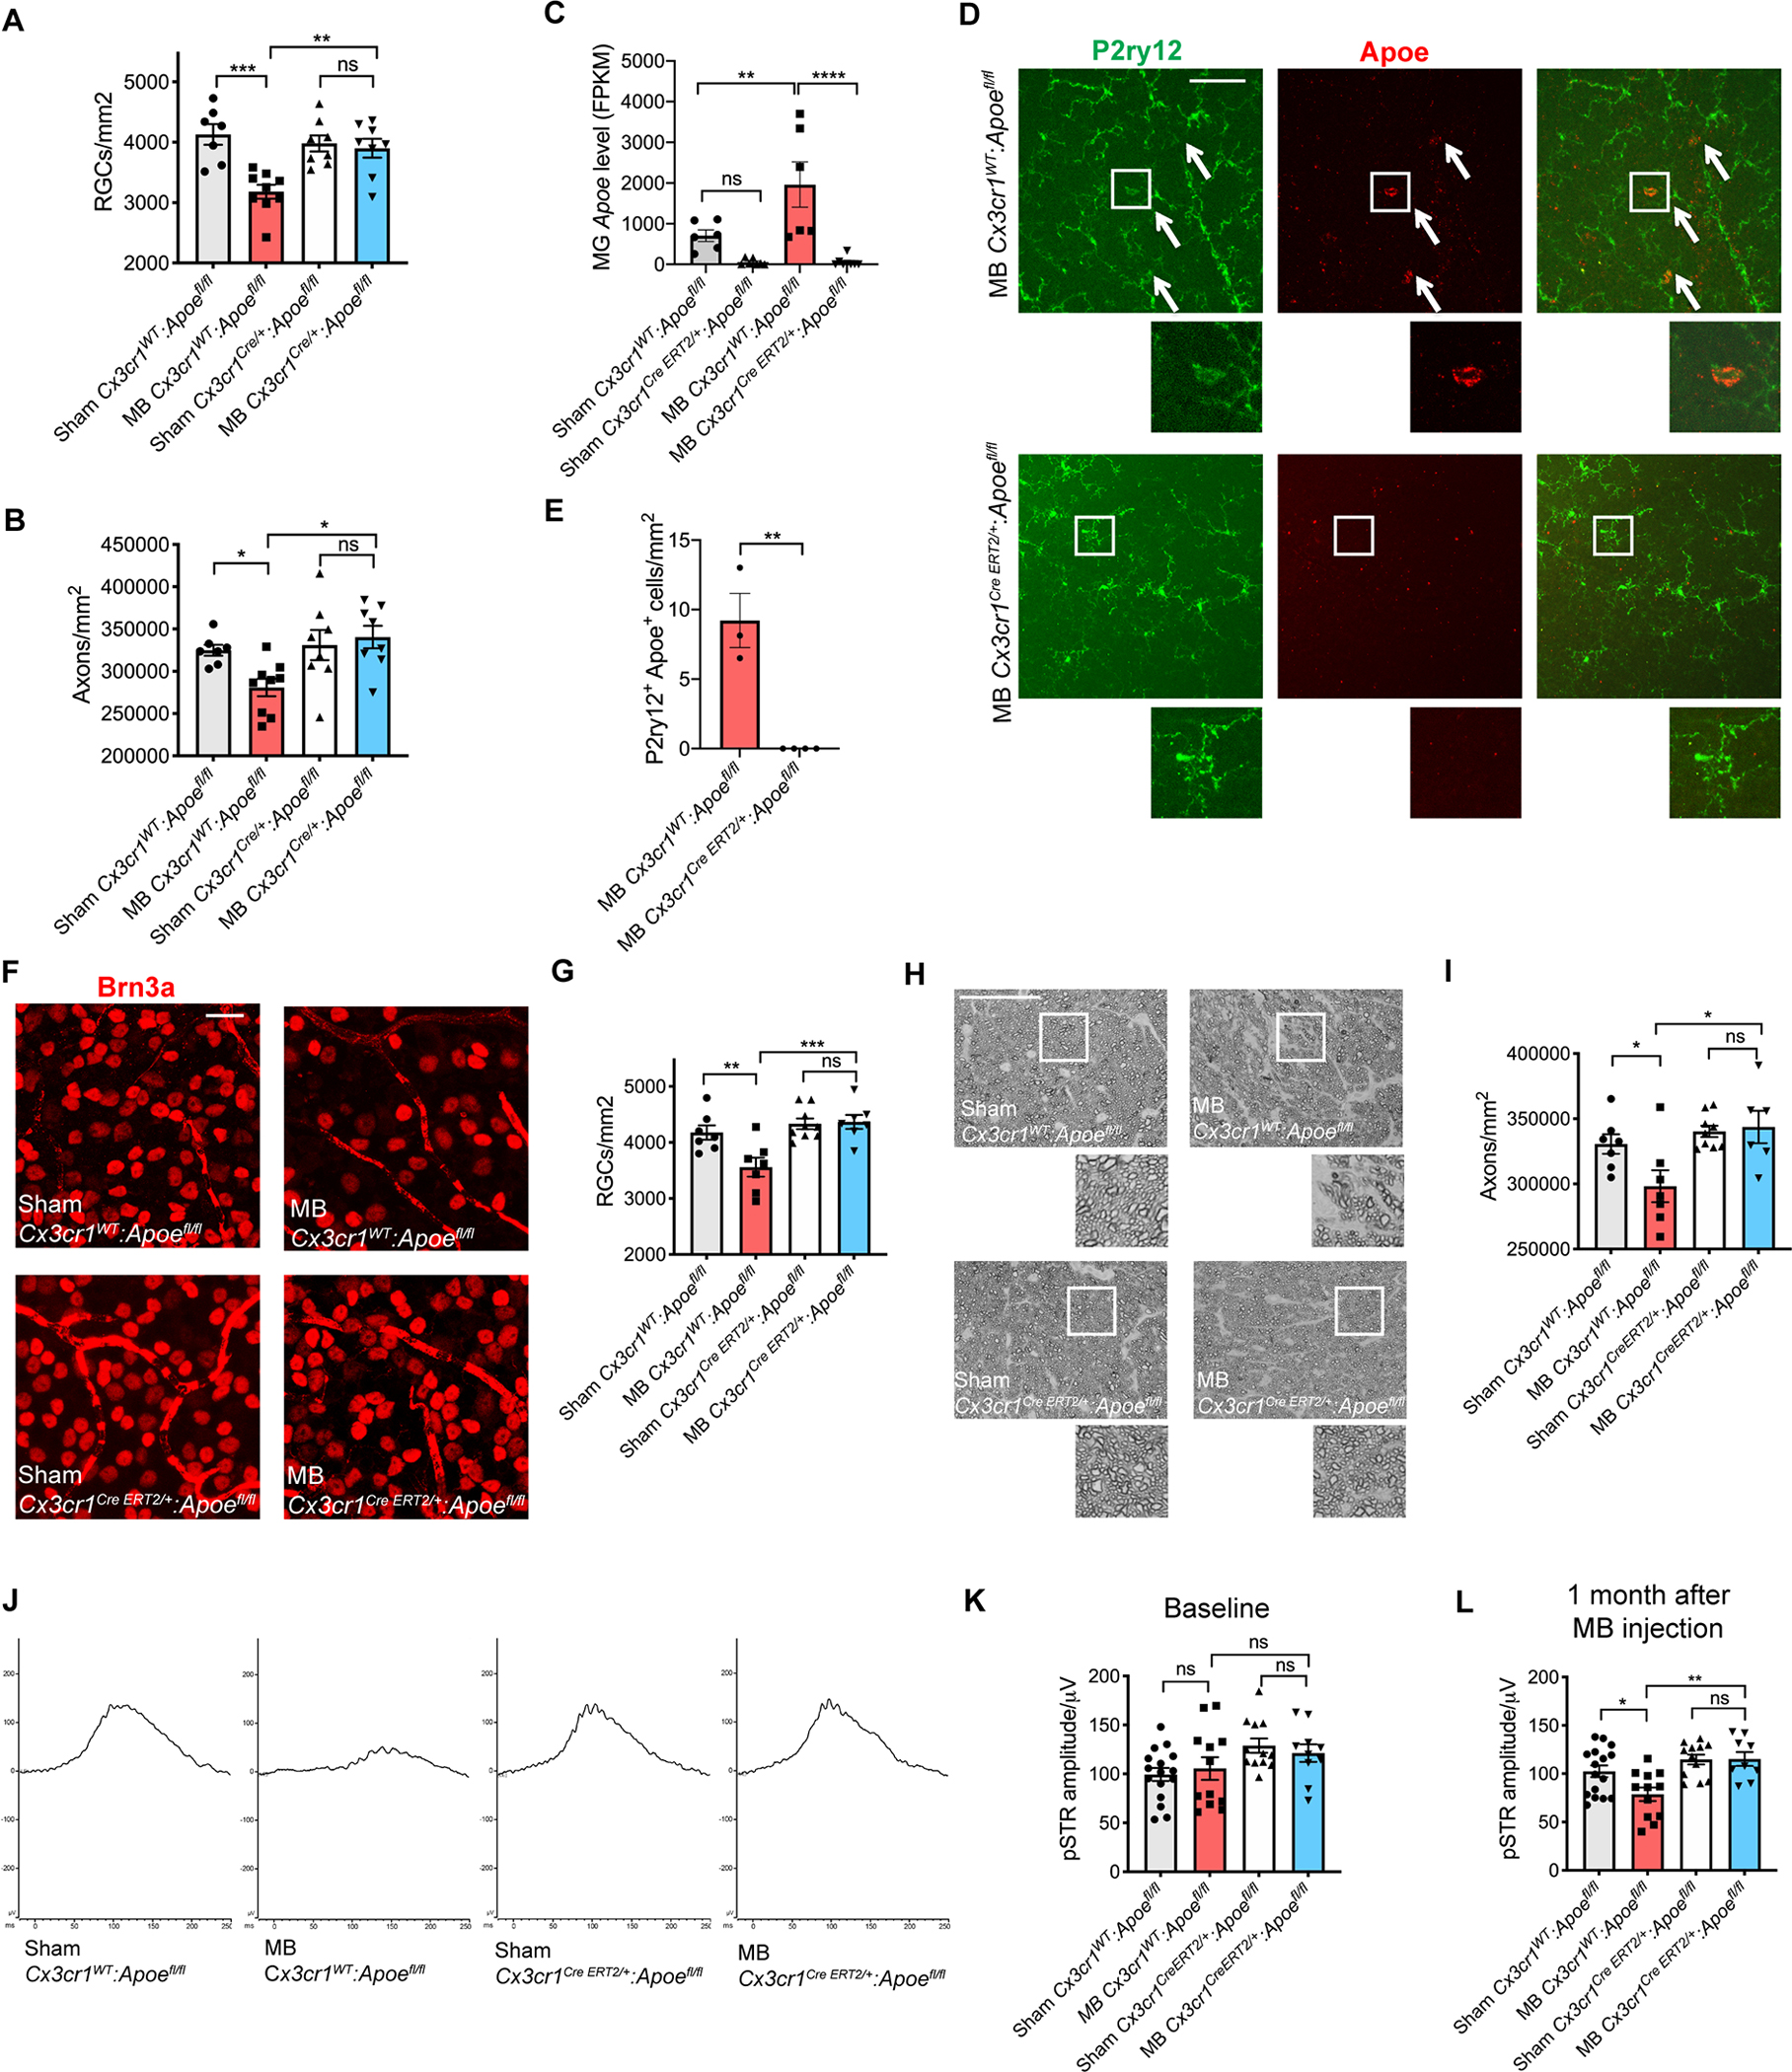
A,B) Quantification of retinal ganglion cell (RGC) cell body numbers (A) and axon counts (B) in microbead-injected (MB) and sham-injected Cx3cr1Cre/+:Apoefl/fl and Cx3cr1WT:Apoefl/fl retinas. Compared using one-way ANOVA (n=7–9 per group). C) Apoe mRNA in sorted retinal microglia (MG) from Cx3cr1CreERT2/+:Apoefl/fl animals and Cx3cr1WT:Apoefl/fl control animals one month after sham or MB injection (n=6–8 per group). Dot plots showing FPKM values compared using one-way ANOVA. D,E) Representative images (D) and quantification (E) showing upregulation of Apoe protein in P2ry12+ cells in MB Cx3cr1WT:Apoefl/fl control animals and lack of upregulation in Cx3cr1CreERT2/+:Apoefl/fl animals, n=3–4 per group. Arrows show co-expressing cells in retinal midperiphery. Scale bar 100 μm. Compared used two-tailed Student’s t-test. F) Representative images of Brn3a+ RGCs in Cx3cr1CreERT2/+:Apoefl/fl and Cx3cr1WT:Apoefl/fl retinas one month after MB or sham injection (n=7–9 per group). Scale bar 20 μm. G) Quantification of RGC cell body numbers compared using one-way ANOVA. H,I) Representative images (H) and quantification (I) of p-phenylenediamine (PPD) staining of optic nerves from animals in (F). Scale bar 50 μm. Compared using one-way ANOVA. J) Representative positive scotopic response (pSTR) electroretinogram traces of MB and sham-injected Cx3cr1CreERT2/+:Apoefl/fl and Cx3cr1WT:Apoefl/fl eyes 1 month after MB injection. K,L) Quantification of pSTR amplitude of animals in (J) at baseline (P>0.55) (K) and one month (L) after MB injection (n=9–16 animals per group). Data in C were obtained from one independent experiment, while the rest of the data were each pooled from 2–3 independent experiments. All results are shown as mean +/− SEM; *P<0.05, **P<0.01, ***P<0.001, ****P<0.0001, ns = not significant. See also Figure S3.