
Figure 6. Humanized APOE4 mice are protected from RGC loss in the microbead glaucoma model.
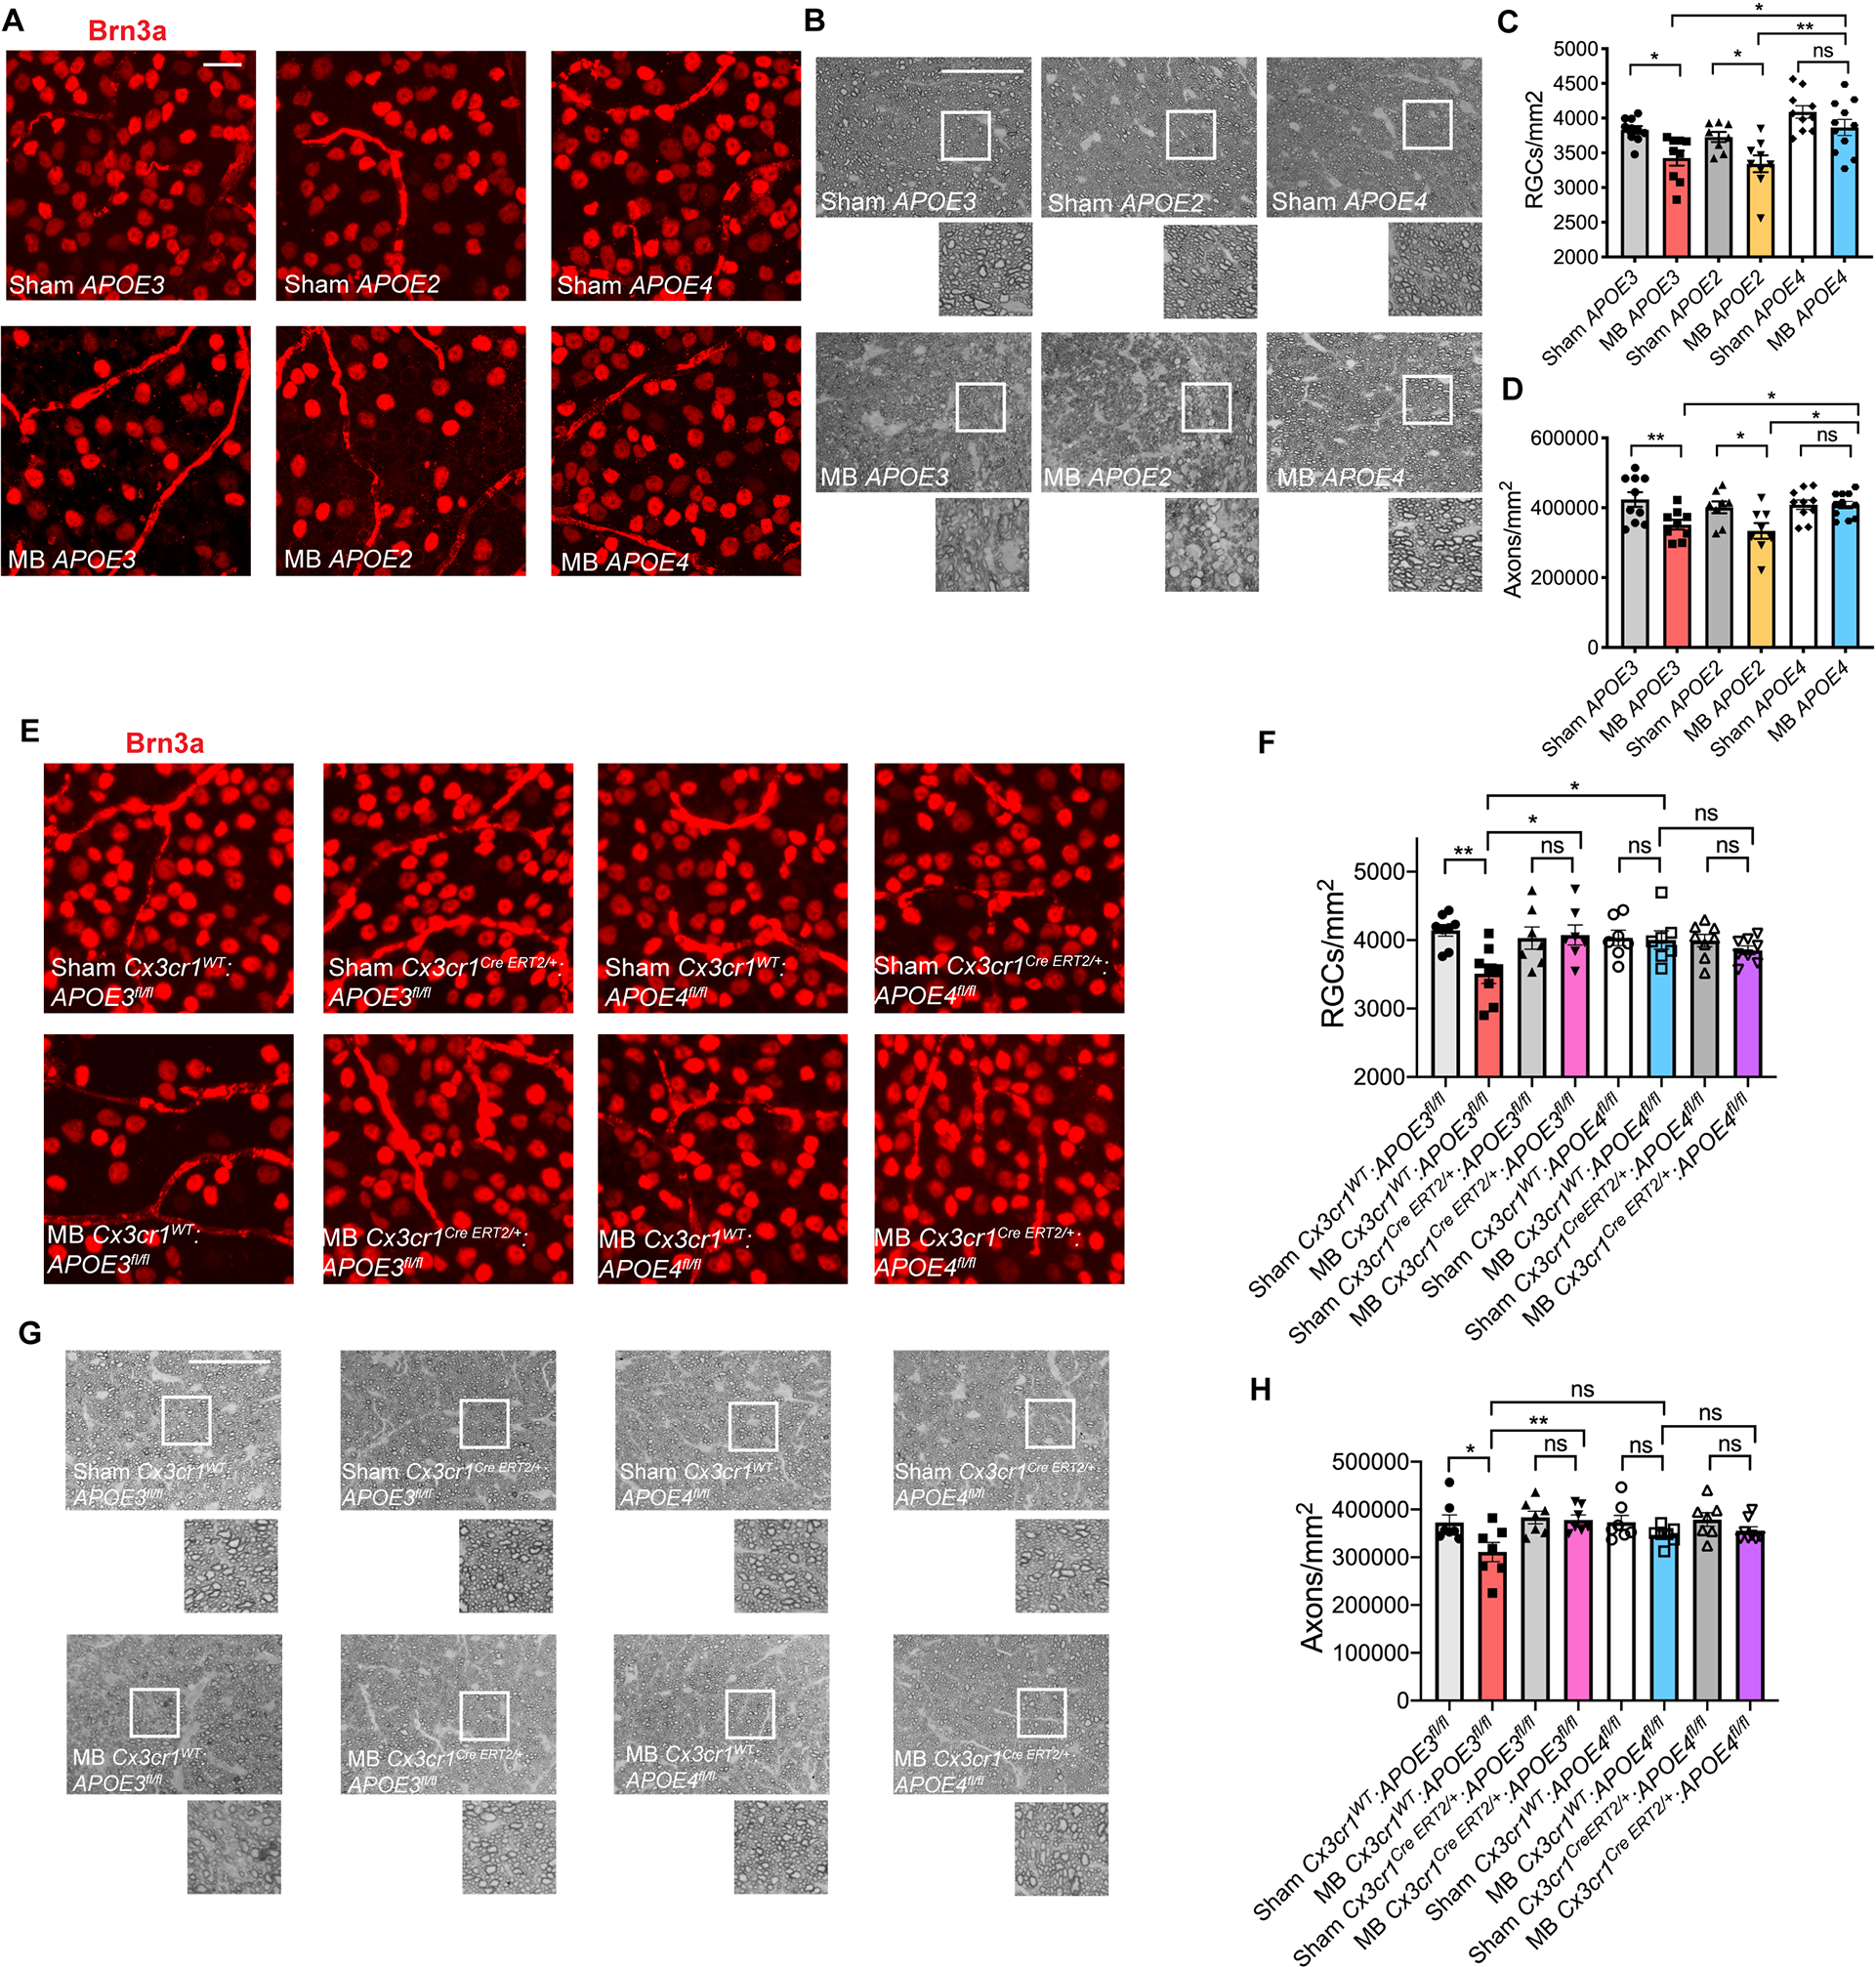
A) Representative images of Brn3a+ retinal ganglion cells (RGCs) in microbead-injected (MB) and sham-injected humanized APOE2, APOE3 and APOE4 retinas (n=8–11 per group). Scale bar 20 μm. B) Representative images of p-phenylenediamine (PPD) staining of optic nerves from MB and sham-injected humanized APOE2, APOE3 and APOE4 animals. Scale bar 50 μm. C) Quantification of RGC cell body numbers in (A) compared using one-way ANOVA. D) Quantification of axon counts in (B) compared using one-way ANOVA. E) Representative images of Brn3a+ RGCs in tamoxifen-treated MB and sham-injected Cx3cr1WT:APOE3fl/fl, Cx3cr1CreERT2/+:APOE3fl/fl, Cx3cr1WT:APOE4fl/fl, Cx3cr1CreERT2/+:APOE4fl/fl retinas (n=7–8 per group). Scale bar 20 μm. F) Quantification of RGC cell body numbers compared using one-way ANOVA. G) Representative images of PPD staining of optic nerves from animals in (E). Scale bar 50 μm. H) Quantification of axon counts compared using one-way ANOVA. Data in A-D and E-H were each pooled from 2–3 independent experiments. All results are shown as mean +/− SEM, *P<0.05, **P<0.01, ns = not significant. See also Figure S6.