
Figure 7. APOE4 retinal microglia remain homeostatic in glaucoma.
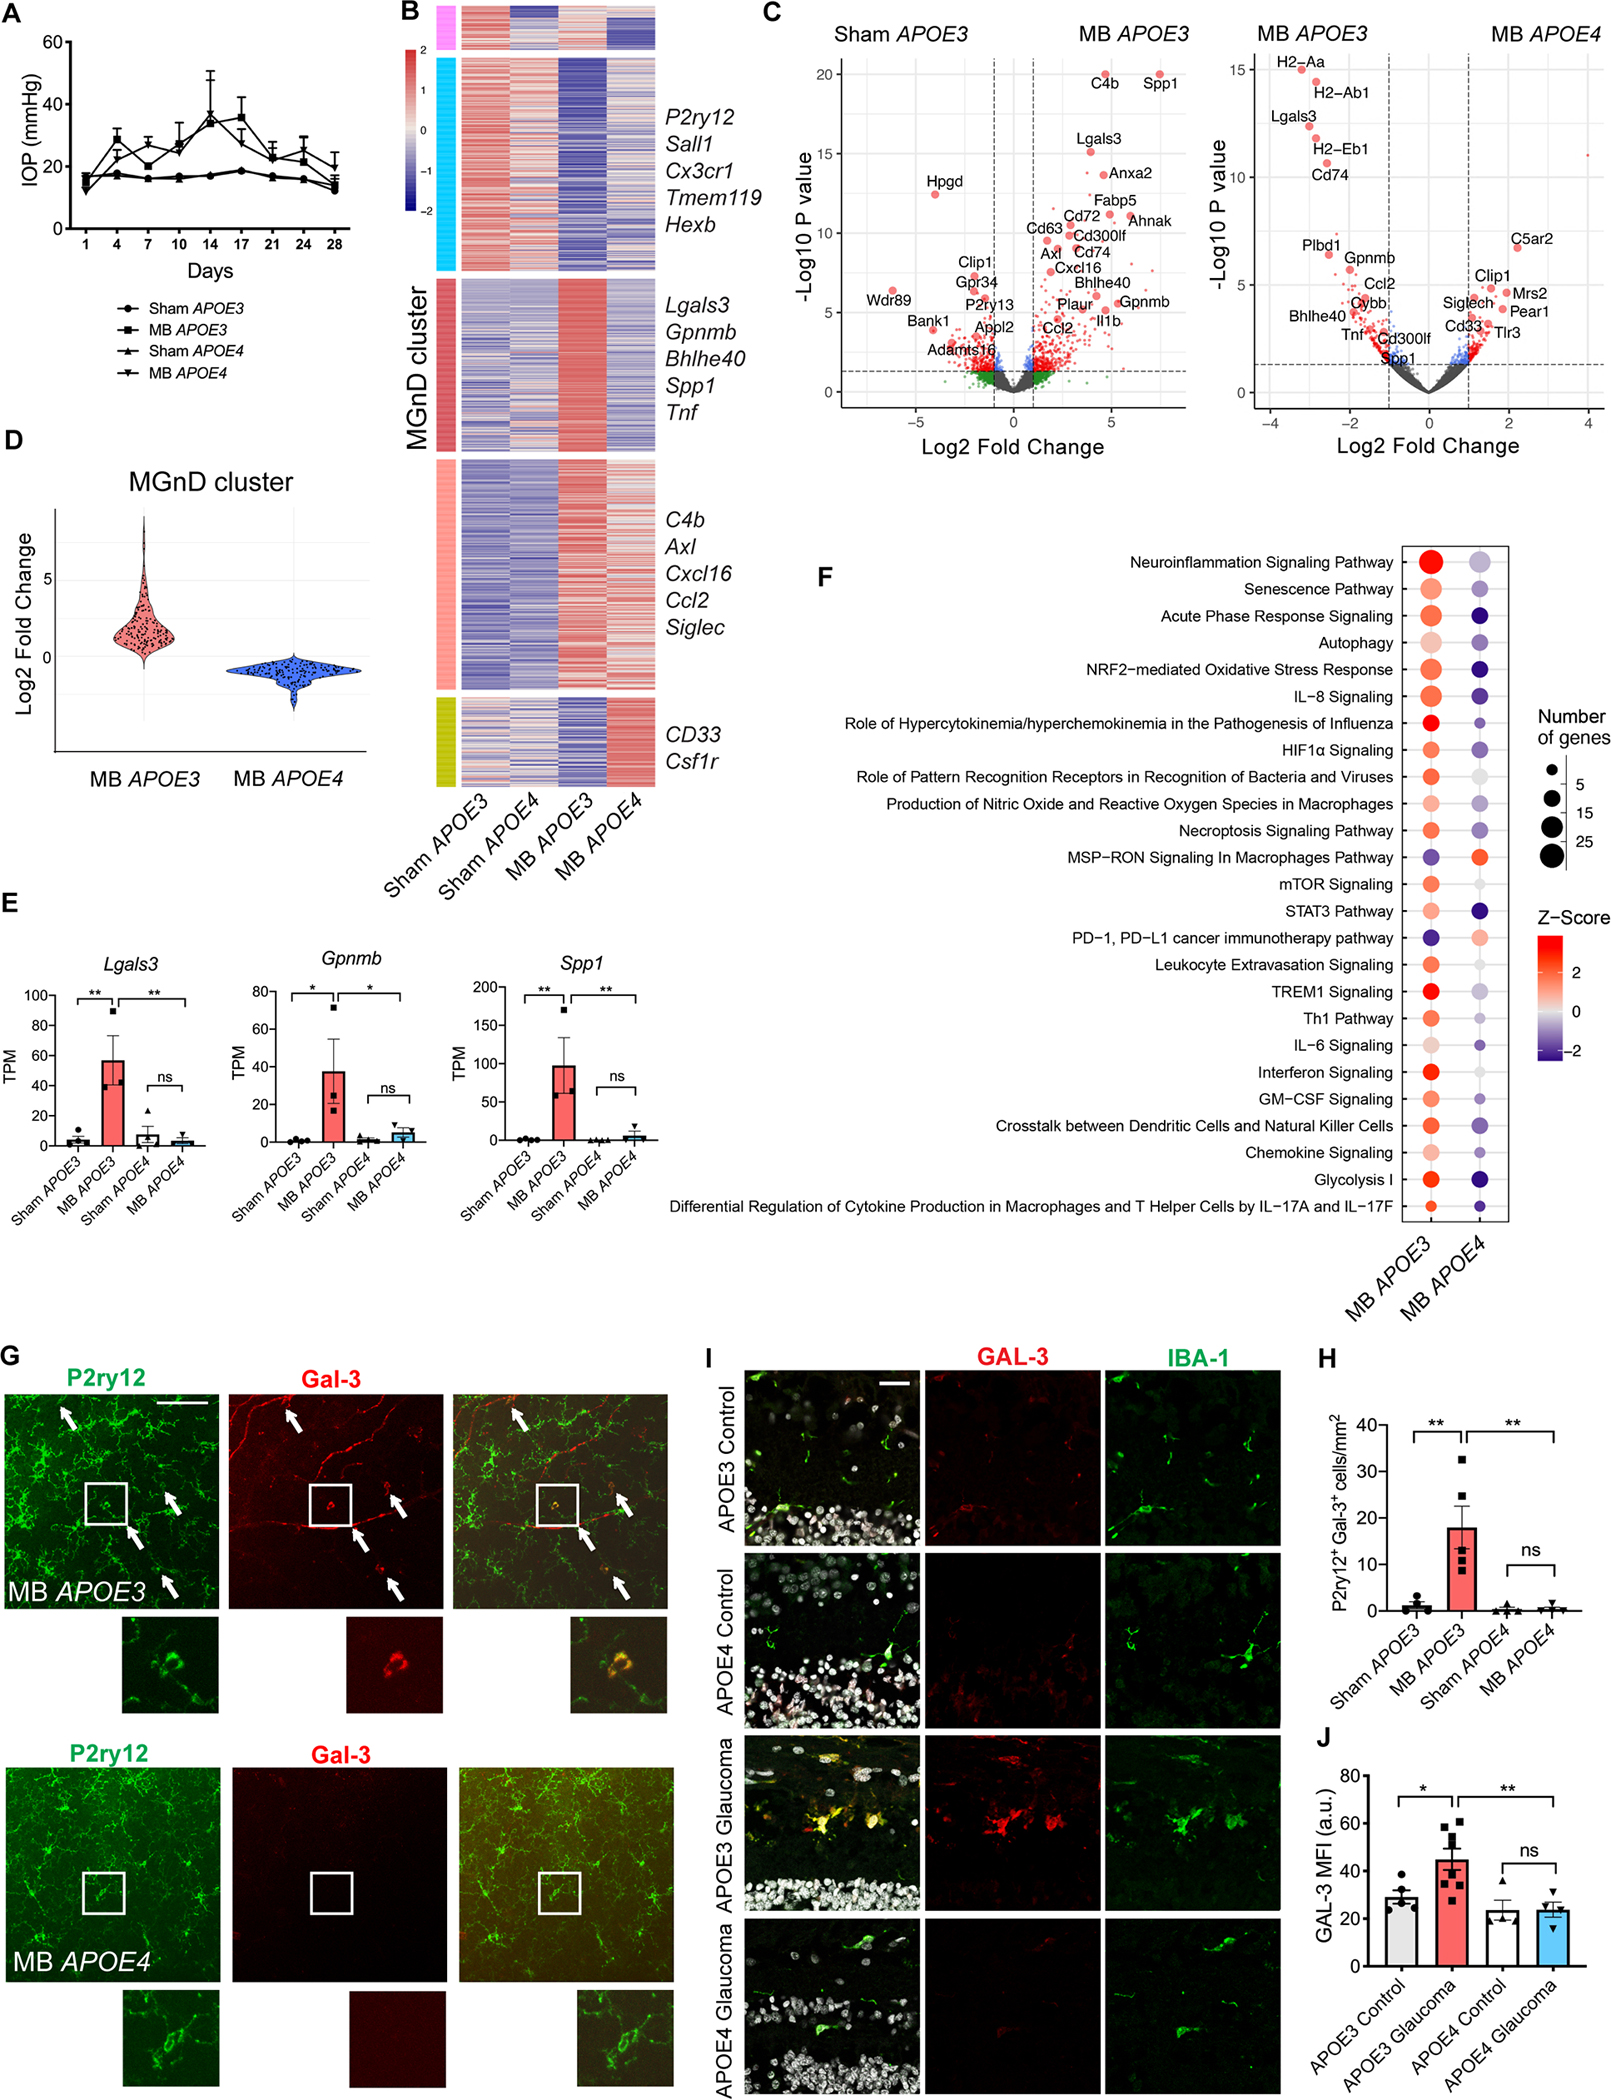
A) Intraocular pressure (IOP) measurements of microbead-injected (MB) and sham-injected humanized APOE3 and APOE4 male mice (n=3–4 per group). B) Heatmap of differentially expressed microglial genes between MB and sham-injected APOE3 and APOE4 mice. MGnD cluster highlighted in red. See also Table S5. C) Volcano plots of differentially expressed microglial genes between MB and sham-injected APOE3 eyes, and MB APOE3 and APOE4 eyes. D) Violin plot showing differences in MGnD cluster gene upregulation between MB APOE3 and APOE4 mice. E) Select neurodegeneration-associated genes from (B). Dot plots showing TPM values compared using one-way ANOVA. F) Top 25 differentially expressed canonical pathways in retinal microglia from MB APOE3 and APOE4 mice as determined by Ingenuity Pathway Analysis. G) Representative images showing upregulation of Galectin-3 protein in P2ry12+ cells in MB APOE3 retinas and lack of upregulation in MB APOE4 retinas, n=4–5 per group. Arrows show co-expressing cells in retinal midperiphery. Scale bar 100 μm. I) Cross-sections of human retinas from APOE3 and APOE4 allele carriers with and without glaucoma stained with IBA1, Galectin-3, and DAPI, n=4–8 per group. Scale bar 25 μm. H) Quantification of (G) shown as the number of P2ry12+ Gal-3+ cells per mm2 retina and compared used one-way ANOVA. J) Quantification of Galectin-3 mean fluorescence intensity (MFI) of human retinal sections in (I) compared used one-way ANOVA. a.u. = arbitrary units. Data in A-F and I-J were each obtained from one independent experiment, while data in G-H were obtained from two pooled independent experiments. All results are shown as mean +/− SEM, *P<0.05, **P<0.01, ns = not significant. See also Figure S6 and Table S5.