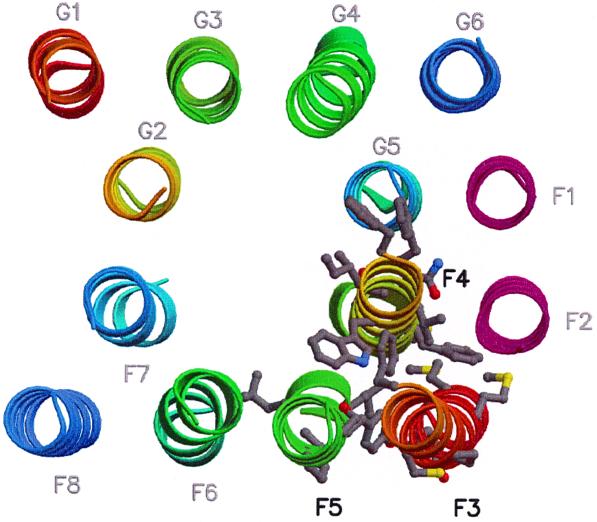
FIG. 5.
Location of mutations in the three-dimensional model of the MalFG core (11). Transmembrane helices (MalF, F1 to F8; MalG, G1 to G6) are shown as ribbons. Color coding is from red to blue along the sequence, except for F1 and F2 (in pink). Mutated residues on helices F3 to F5 are shown as grey ball-and-stick representations. Helices F3 and F4 were extended in the three-dimensional model to include all observed mutations. The figure was produced with Molscript (16) and Raster3D (18).

