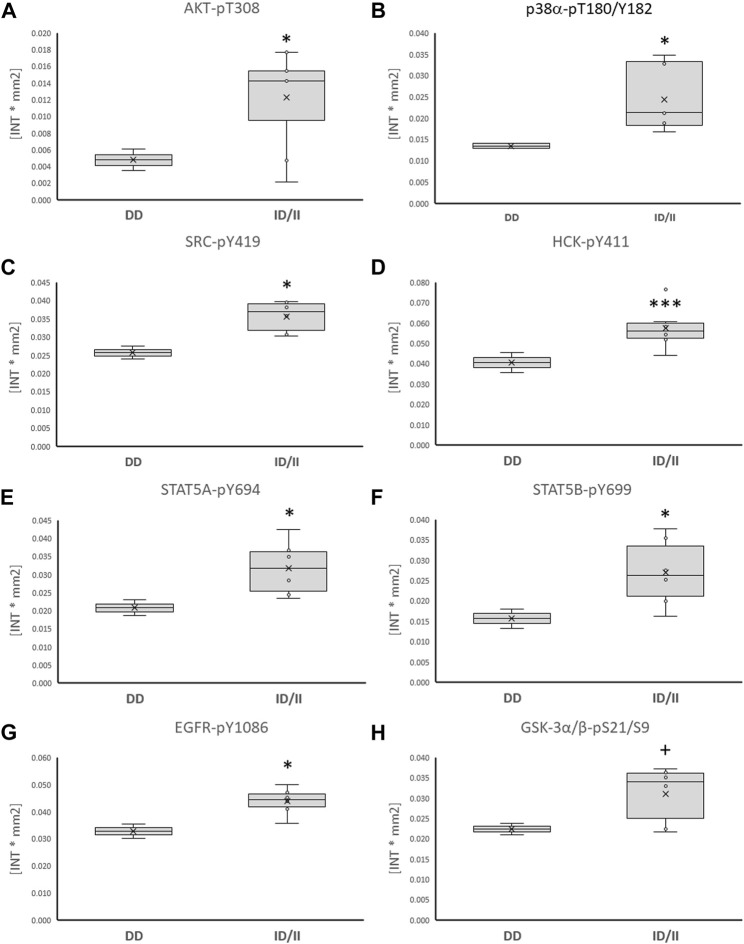
FIGURE 5.
Phosphotransferases demonstrating ACE-I/D genotype differences post exercise. Box-Whisker plots of the (referenced) values for the phosphorylation of glucose metabolism related phosphotransferases in the fit carriers (ACE-ID/II) and non-carriers of the ACE I-allele (ACE-DD) as average of values ½ and 8 h after one-legged exercise. (A) AKT-pT308, (B) p38α-pT180/Y182, (C) SRC-pY419, (D) HCK-pY411, (E) STAT5A-pY694, (F) STAT5B-pY699, (G) EGFR-pY1086, (H) GSK3α/β-pS21/S9. +, * and ***, p < 0.10, <0.05, <0.001 for differences vs. ACE-DD genotype. ANOVA for the factor ACE-I/D genotype.

