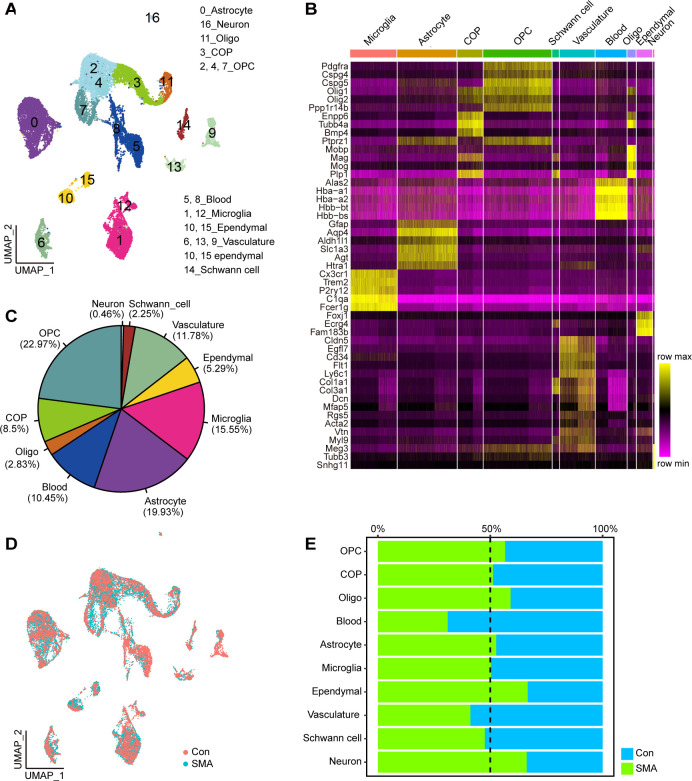
Fig 1. Cell type identification.
(A) UMAP visualization showing the cluster of cell type from scRNA-seq. (B) The heatmap shows the average expression of marker genes for each cell type. The darker the yellow, the higher the expression level. (C) The proportion of each cell type to the total number of cells. (D) UMAP visualization showing the distribution of SMA and control cells. (E) Proportion of cells from SMA or control samples in each cell type.

