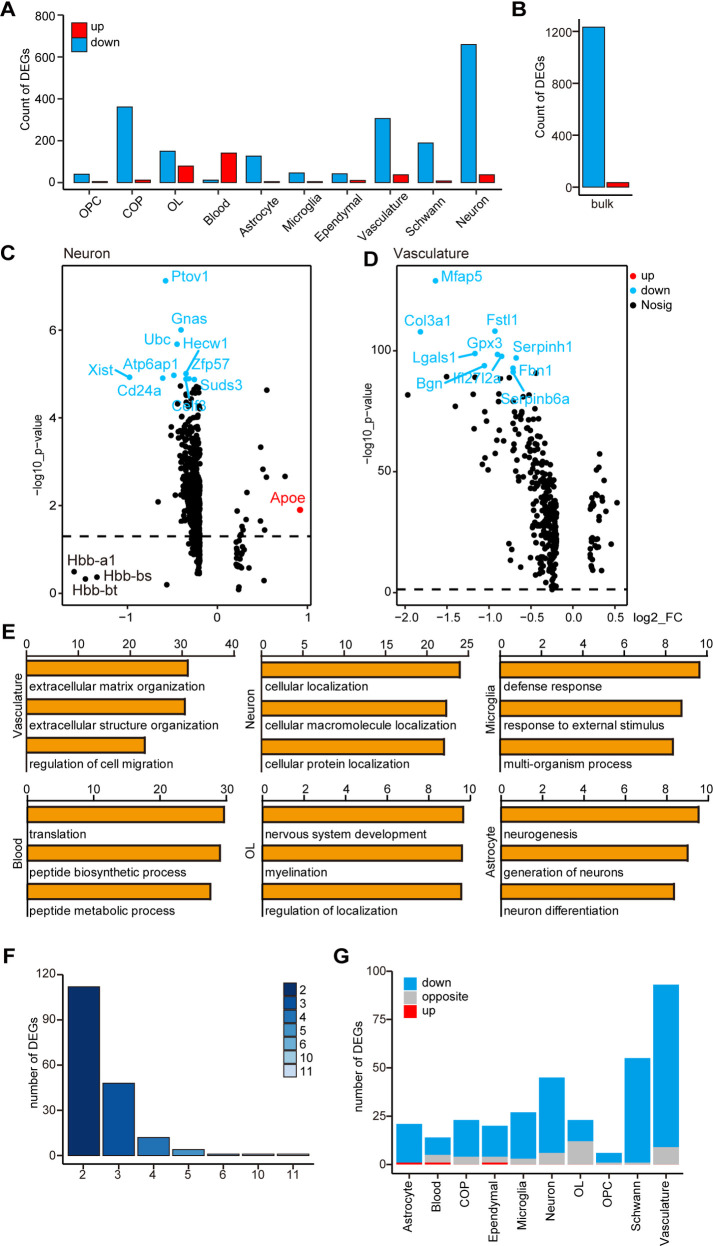
Fig 2. Analysis of DEGs and functions of scRNA-seq and bulk-seq.
(A) The number of DEGs in different cell types in scRNA-seq. (B) Number of DEGs in bulk-seq. (C) A volcano plot showing DEGs in neurons. (D) Volcano plot showing DEGs of the vasculature. The x-axis represents logFC, and the y-axis represents log10 p-value. (E) GO analysis of DEGs in several cell types; the x-axis represents log10 p-value. Four cell types are not shown in the figure. The results of Schwann cells, OPCs, and COPs are similar to that of OLs, and the p-value of ependymal cells is >10−5. (F) An overlap gene analysis of cell-type-specific DEGs and bulk-seq DEGs; the y-axis represents the number of genes, and the x-axis represents the number of cell types; for example, the column with the column head “3” represents the number of overlapping DEGs of the bulk-seq and two cell types. (G) We analyzed whether the change trends of cell-type-specific DEGs in scRNA-seq and DEGs of bulk-seq are the same; blue indicates the same trend, and both are downregulated, red indicates the same trend, and both are upregulated, and gray indicates opposite trends.

