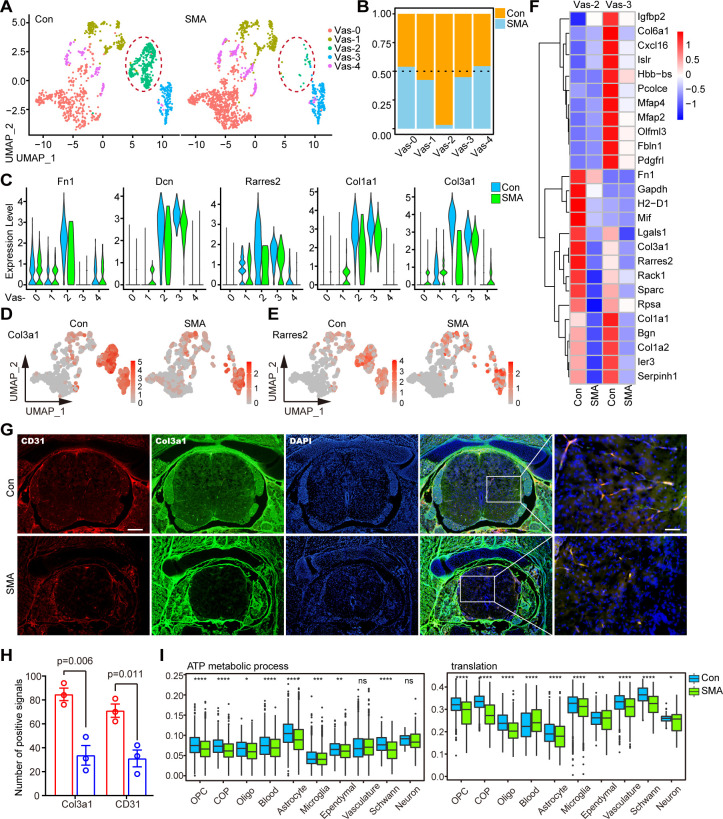
Fig 6. Subpopulation of perivascular fibroblasts was drastically reduced in SMA spinal cord.
(A) UMAP visualization showing the subtypes of vasculature in control and SMA mice. Vas-2 is marked by red circles. (B) Comparison of the cell numbers of various subtypes in the vasculature of SMA and control mice. (C) Violin plots showing the expression of fibroblast marker genes in vasculature subtypes. (D, E) UMAP visualization showing the expression of Col3a1 and Rarres2 in the vasculature of SMA and control mice. (F) Expression analysis of the top 13 most significant DEGs in two fibroblast subtypes, Vas-2 and Vas-3. (G) Immunofluorescence staining of spinal cord transections in SMA and control mice. Here, 4’,6-diamidino-2-phenylindole (DAPI)-labeled nuclei are indicated in blue, Col3a1-labeled fibroblasts are indicated in green, and CD31-labeled vascular endothelial cells are indicated in red. Bar = 200μm (left) and 50 μm (right). (H) Statistical results of staining for CD31 and Col3a1. The P-value is calculated by Student’s t-test, n = 3, bars represent the mean with SEM. (I) Expression analysis of protein synthesis (translation) and energy metabolism (ATP metabolic process) pathways of various cell types in SMA and control mice. p-values were calculated through the t-test, ns: p > 0.05, *: p < 0.05, **: p < 0.01, ***: p < 0.001, ****: p < 0.0001.

