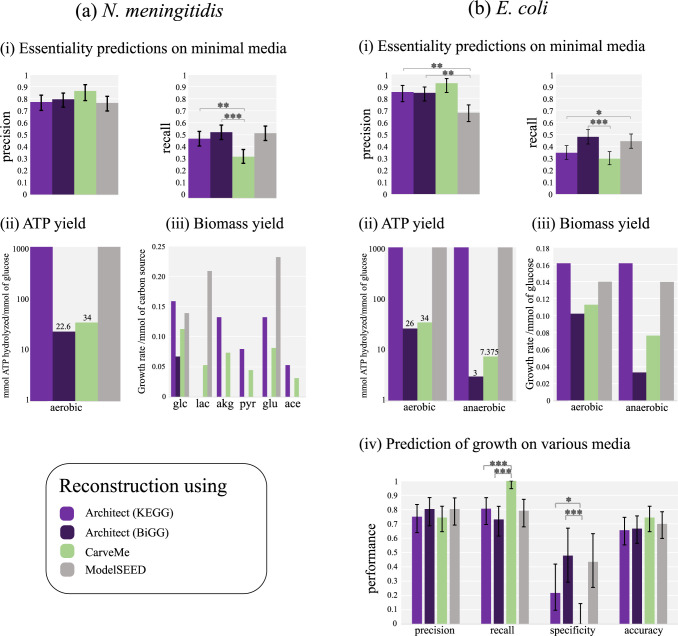
Fig 4. Comparison of simulation results of Architect, CarveMe and ModelSEED in (a) N. meningitidis and (b) E. coli.
Panel (i) shows the performance of each tool in predicting essential genes in minimal media. Yield of ATP and biomass are shown in panels (ii) and (iii) given 1 mmol of glucose and alternate carbon sources in N. meningitidis, and under presence and absence of oxygen in E. coli. Panel (iv) shows the performance of individual tools in predicting the capacity to grow on alternate media. Error bars show the 95% confidence interval for individual performance measures, each considered as the estimate of a binomial parameter. In those cases, p-values are computed using Fisher’s exact test and only between Architect-BiGG or Architect-KEGG and other tools (with *, ** and *** representing p less than 0.05, 0.005 and 0.0005 respectively).

