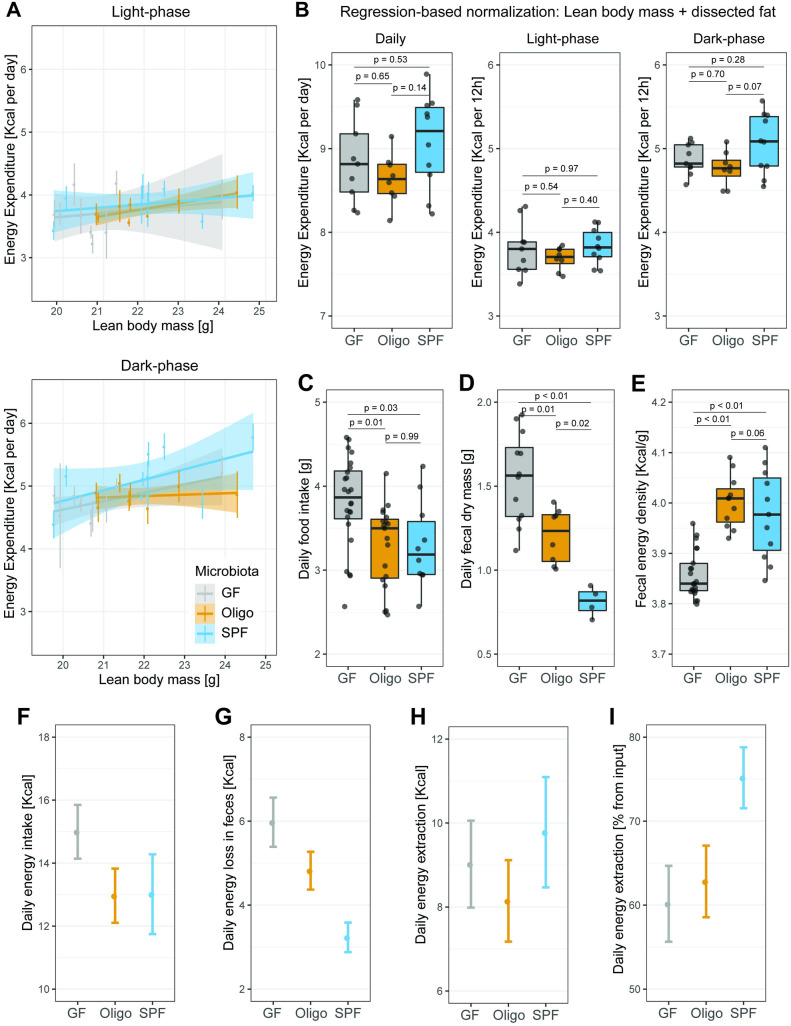
Fig 2. Energy metabolism in GF, OligoMM12, and SPF C57B6/J mice.
(A) Linear regression of energy expenditure and lean body mass based on EchoMRI during light and dark phase. Each colored vertical line represents energy expenditure measurements during the experiment for 1 mouse. (B) Energy expenditure during 24-h period or during the 12-h light or dark phase. Values represent area-under-curve normalized by regression-based analysis using lean body mass obtained by EchoMRI and dissected fat mass. (C) Average daily food intake per mouse. Mice represented in this figure include those that underwent long-term indirect calorimetry (Fig 3) and mice that only contribute to daily fecal pellet quantification/bomb calorimetry. (N of mice per group: GF = 24, OligoMM12 = 19, SPF = 10) (D) Dry fecal output per mouse collected during a 24-h period. (N of mice per group: GF = 12, OligoMM12 = 8, SPF = 4) (E) Energy content of dry fecal output by bomb calorimetry. (N of mice per group: GF = 21, OligoMM12 = 11, SPF = 11). (F-I) Estimation energy metabolism parameters. Number represented estimate mean value ± 1.96*combined standard uncertainty from measurements used for calculations. (F) Estimated daily energy input (food intake* 3.94 kcal/g). (G) Estimated daily energy excretion (daily fecal dry mass*fecal energy content). (H) Estimated daily energy extraction (daily energy input–daily energy excretion). (I) Estimated energy extraction from food as percentage of energy input ((daily energy input − daily energy excretion)/daily energy input*100). Note that calculations in F, G, and H are per mouse and are not normalized to body mass. Number of mice per group in all figures unless otherwise specified: GF = 9, OligoMM12 = 8, SPF = 10. p-values obtained by Tukey’s honest significance test. Data underlying this figure are supplied in S1 Data. GF, germ-free; SPF, specific-opportunistic-pathogen-free.

