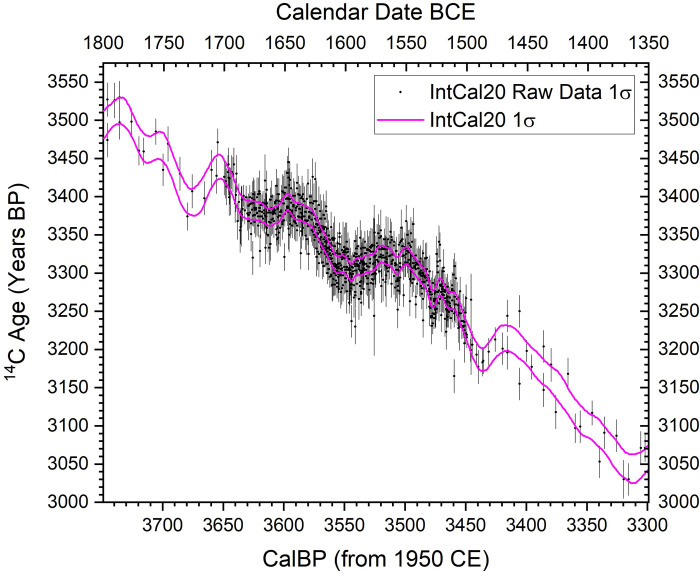
Fig 1. IntCal20 modelled 14C calibration curve (1σ) and the raw 14C data (1σ) used to compile this curve showing the period 1800–1350 BCE [41].
The notable density of data available for the interval 1700–1500 BCE is evident (most new as part of IntCal20), as also the much better definition that is therefore available for the modelled IntCal20 curve over this period. The constituent IntCal20 dataset is available from: http://intcal.org/.

