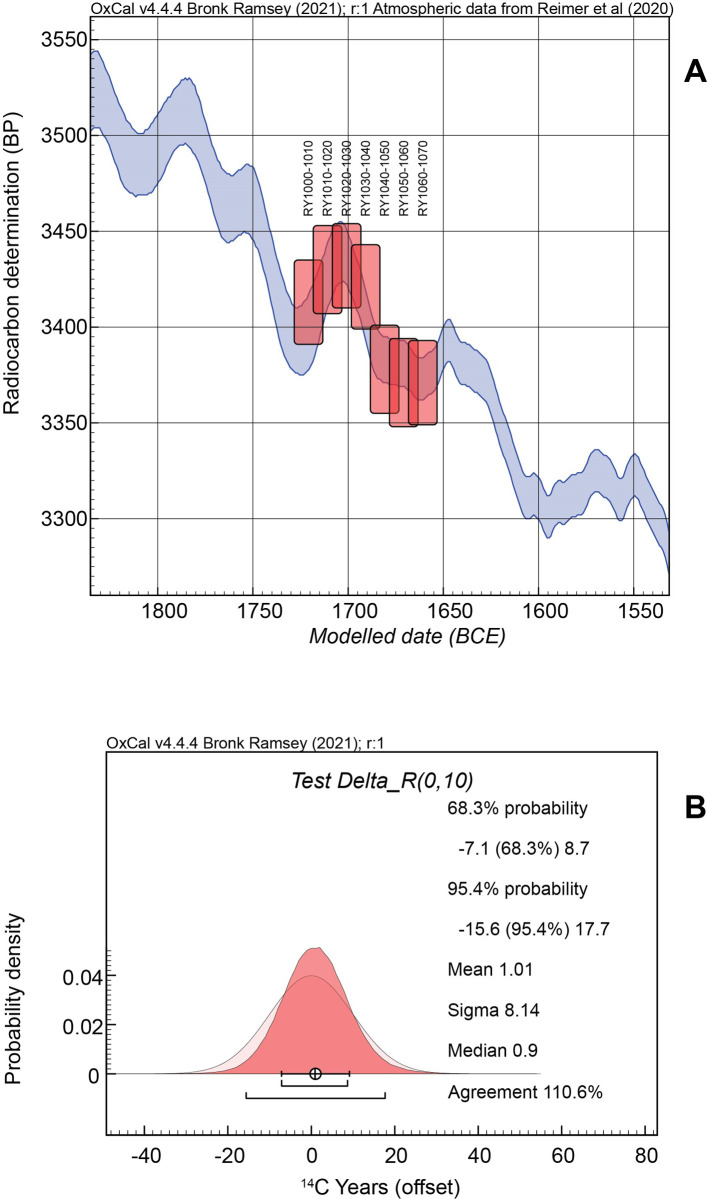
Fig 5. Results of a neutral (0 ± 10 14C years) Delta_R test for a growing season related offset (GSRO) for the tree-ring defined time-series from an oak sample from LMIA Miletos, western Anatolia.
(A) The seven weighted average 14C values [132] for 11 tree-rings (years) samples, Relative Years (RY)1000-1010 … to RY1060-1070, each spaced (mid-points of each block) 10 rings = calendar years apart (from pairs of 14C data in each case: see S1A Table nos. 20–33) show a good, ordered, fit against the IntCal20 14C calibration curve [41]. The IntCal20 curve is shown as a 68.3% highest probability band and the Miletos samples are shown with the boxes illustrating, y axis, the weighted average 14C ages plus or minus 1σ, and, x-axis, the 68.3% highest posterior density (hpd) calendar placement of each element of the time-series. (B) The Delta_R test indicates a ~0 to very negligible offset (mean difference: 1.01 ± 8.14 14C years) versus the 0 ± 10 14C years prior (see below: Bayesian chronological modelling).

