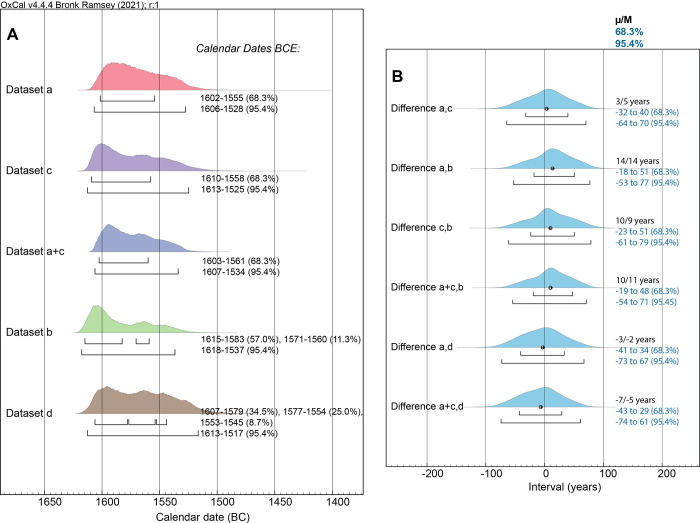
Fig 7.
Comparison of the calendar dating probabilities for the Boundary after the datasets (a), (b), (c) and (d), and for dataset (a)+(c), and investigation of likely temporal difference between these datasets. (A) The posterior probability distributions from the models for each dataset and for datasets (a)+(c) combined with the 68.3% and 95.4% hpd ranges indicated by the upper and lower lines under each distribution. (B) The time interval (OxCal Difference query) between the posterior probability distributions–from (A)–for dataset (a) versus (c) and (a) versus (b), for dataset (c) versus (b), for datasets (a)+(c) versus (b), for dataset (a) versus (d) and for datasets (a)+(c) versus (d). The mean (μ) and median (M) of each difference is stated (in calendar years) as well as the 68.3% and 95.4% probability ranges.

