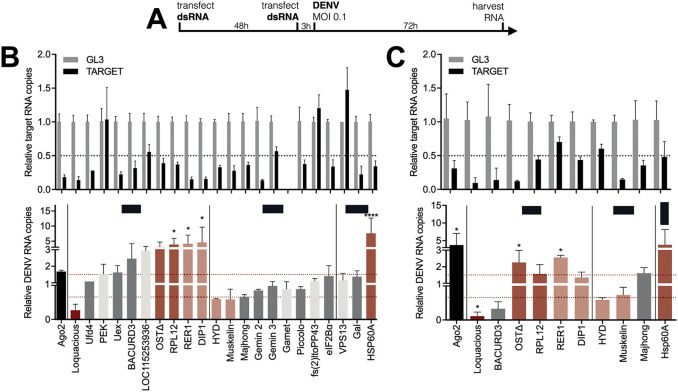
Fig 3. Functional screen identifies Loqs as a DENV proviral host factor in Aedes mosquitoes.
A. Schematic outline of the functional RNAi screen. B-C. Relative quantification of target gene expression (top panel) and DENV RNA levels (lower panel) in U4.4 cells upon silencing of the indicated genes. Selected genes from the initial screen (B) were tested in an independent validation screen (C) using dsRNA targeting a different region of the gene. Expression was quantified by RT-qPCR, normalized to the house-keeping gene ribosomal protein L5, and expressed relative to expression in cells treated with dsRNA targeting firefly luciferase (GL3). Ago2 was used as a positive control. Data represent means and standard deviation of three replicates. Color coding represents classification of hits based on gene knockdown efficiency, phenotype, and consistency between screens. Light grey, inefficient knockdown (< 0.5-fold); dark grey, no phenotype despite efficient knockdown (> 0.5-fold); dark red, strong hit with efficient knockdown and DENV RNA levels < 0.66-fold or >1.5-fold in both dsRNA sets; light red, weak hits for which one of the criteria was not met. One-way ANOVA were used to determine statistically significant differences with the GL3 control, with: * p < 0.05; ** p < 0.01; *** p < 0.001; **** p < 0.0001.

