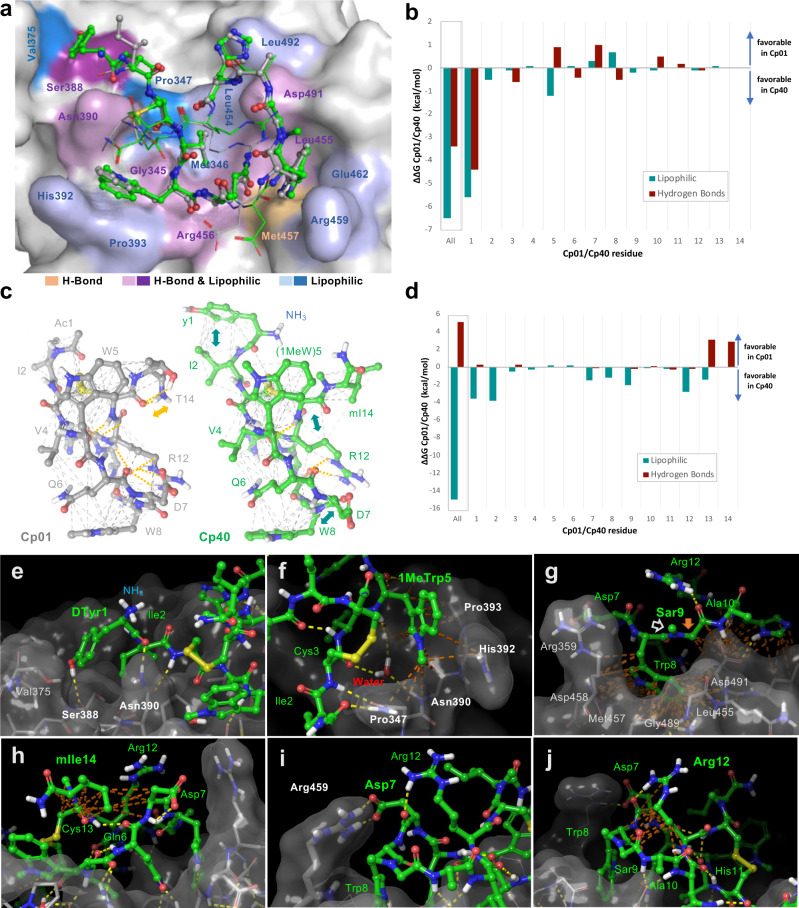
Fig. 3. Interaction profiles of compstatin analogs Cp01 and Cp40 showing contributions of intermolecular (a,b) and (c,d) intramolecular H-bonds and hydrophobic contacts.
a Contact residues on the target protein engaging in H-bonds (yellow), lipophilic contacts (blue) or both (purple) are highlighted on the surface of C3b. Contacts only present in Cp01 but not Cp40 are show in pastel shades. The structures of Cp01 and Cp40 are shown in grey and green ball-and-stick representation, respectively; residues not engaging in target binding are shown as lines. c Intramolecular contact networks in Cp01 (left) and Cp40 (right) showing H-bonds in yellow and hydrophobic contacts in grey. Analog-specific H-bonds and hydrophobic contacts are marked yellow and cyan arrows, respectively. b, d Differences in binding free energies per residue between Cp01-C3c and Cp40-C3b based on three independent MD simulation runs with distinct initiation parameters. (Supplementary Tables 2–5). Closeup view of the interaction profiles of e D-Tyr1, f (1Me)Trp5, g Sar9, h mIle14, i Asp7, and j Arg12. C3b is shown in stick representation with grey semitransparent surface and Cp40 in green ball-and-stick representation. H-bonds and hydrophobic contacts are marked as yellow and brown dotted lines, respectively.

