Figure 3.
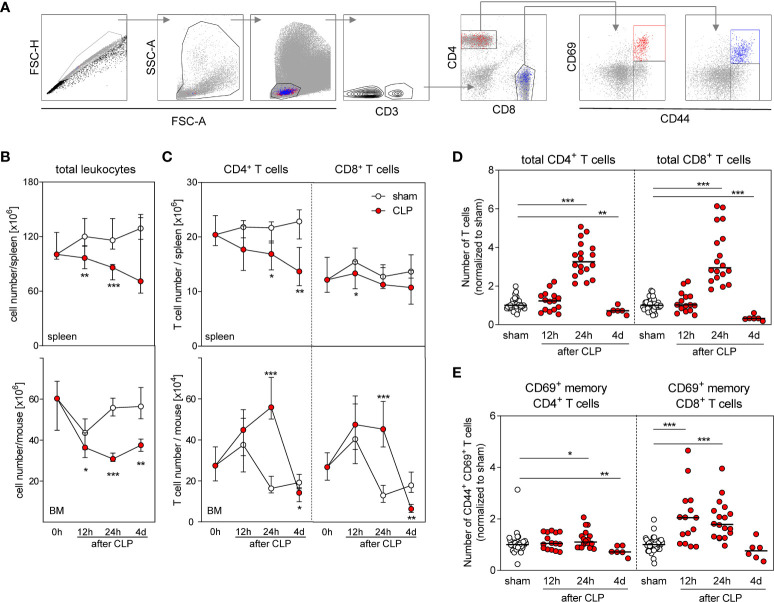
Accumulation and activation of CD8+ T cells in the BM during sepsis. Sepsis was induced in WT mice and BM cells as well as total spleen cells were isolated at the indicated time points after CLP or sham surgery. T cell number and expression of CD69 were determined. (A) Gating strategy. Representative dot plots of BM cells 24 h after CLP are shown. (B) Number of total spleen cells (top) and BM cells (bottom). (C) Number of total CD4+ and CD8+ T cells in the spleen (top) and BM (bottom). (D) Number of CD4+ and CD8+ T cells in the BM normalized to the median of sham mice that was set as 1. (E) Percentage of CD69+ cell among memory CD44+ CD4+ and CD8+ T cells normalized to the median of sham mice that was set as 1. Data show median/interquartile range (B, C) or median (D, E) of n = 7–15 (spleen) or n = 10–16 (BM) mice per group. Mann–Whitney U-test was used to test for statistically significant differences. *p ≤ 0.05; **p ≤ 0.01; ***p ≤ 0.001.

