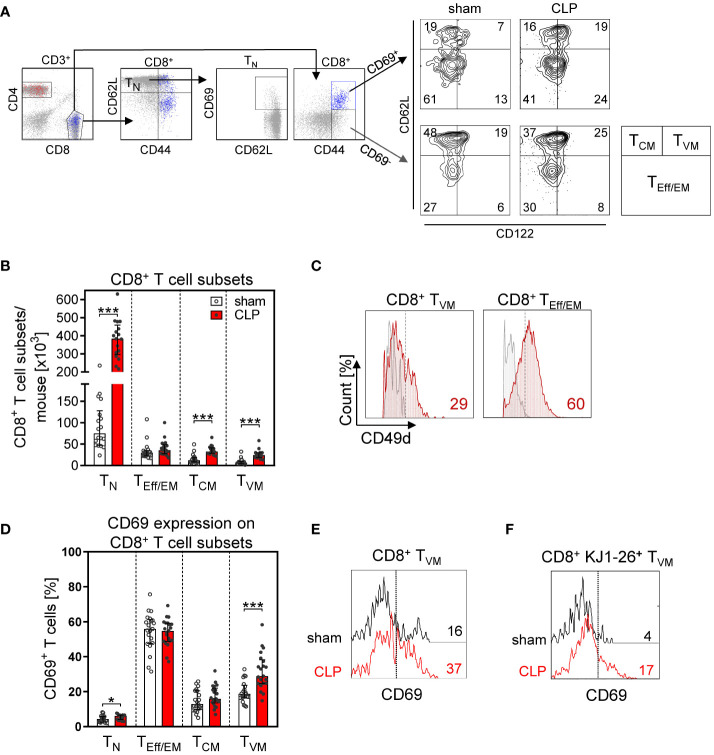
Figure 4.
CD8+ T-cell subset composition and antigen-independent CD8+ T cell activation in the BM after CLP. Sepsis or sham surgery was induced in WT mice and BM cells were isolated 24 h later. The expression of CD69 on diverse CD8+ T-cell subsets was determined by flow cytometry. (A) Gating strategy of naïve (TN), effector/effector memory (TEff/EM), central memory (TCM), and virtual memory (TVM) CD8+ T cells. Representative contour plots of one sham and one CLP mouse are shown. Numbers indicate the percentage of cells in the respective quadrant. (B) Cell count of CD8+ T-cell subsets from individual mice. (C) Expression of CD49d on BM CD8+ TVM cells in comparison with splenic CD8+ TEff/EM cells as positive control. Numbers indicate the percentage of positive cells according to fluorescence minus one (FMO) indicated as gray line. (D) CD69 expression on CD8+ T cell subsets from individual mice. Horizontal lines indicate the median with interquartile range of n = 17–21 mice per group. (E) Histogram of CD69 expression of gated CD8+ TVM from one representative sham and one CLP mouse. The dashed line indicates the threshold for positive staining according to the isotype control. (F) CD8+ T cells from DO11.10 mice were adoptively transferred into WT mice prior to CLP or sham surgery. Transferred ovalbumin-specific cells were identified as KJ1-26+ cells. The histogram depicts the expression of CD69 on gated KJ1-26+ TVM cells from one representative sham and one CLP mouse. Statistically significant differences were tested using the Mann–Whitney U-test. *p < 0.05; ***p < 0.001.

